
Thursday of this past week saw the release of OPEC's April Oil Market Report, which covers OPEC & global oil data for March, and hence it gives us a picture of the global oil supply & demand situation after the breakdown of OPECs agreement to cut oil production in the first quarter, when Saudi and its allies were engaged in an oil price war against the Russians and US shale, but before last week's agreement to cut production by 9.7 million barrels a day. Before we start, we should note as a caveat that estimating oil demand while an epidemic is spreading is pretty much a crapshoot, and hence the numbers we'll be reporting this month should be considered having a much larger margin of error than we'd normally expect from this report..
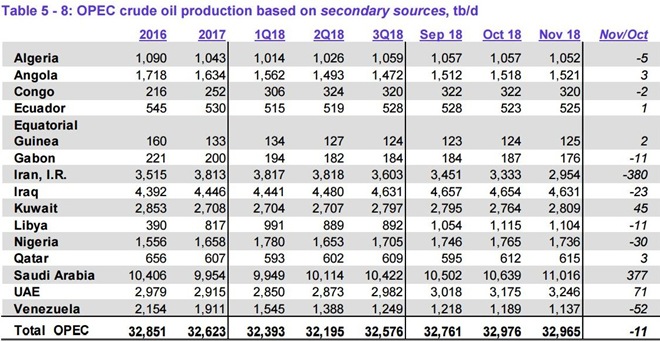
The first table from this monthly report that we'll look at is from the page numbered 45 of that report (pdf page 55), and it shows oil production in thousands of barrels per day for each of the current OPEC members over the recent years, quarters and months, as the column headings indicate. For all their official production measurements, OPEC uses an average of estimates from six "secondary sources", namely the International Energy Agency (IEA), the oil-pricing agencies Platts and Argus, the U.S. Energy Information Administration (EIA), the oil consultancy Cambridge Energy Research Associates (CERA) and the industry newsletter Petroleum Intelligence Weekly, as a means of impartially adjudicating whether their output quotas and production cuts are being met, to thus avert any potential disputes that could arise if each member reported their own figures...

As we can see from the table of oil production data above, OPEC's oil output jumped by 821,000 barrels per day to 28,612,000 barrels per day in March, from their revised February production total of 27,790,000 barrels per day. However that February output figure was originally reported as 27,772,000 barrels per day, which means that OPEC's February production was revised 18,000 barrels per day higher with this report, and hence March's production was, in effect, an 839,000 barrel per day increase from the previously reported OPEC production figures (for your reference, here is the table of the official February OPEC output figures as reported a month ago, before this month's revisions)...
From that OPEC table, we can also see that increases of 388,000 barrels per day from the Saudis, 386,000 barrels per day from the Emirates, and 170,000 barrels per day from Kuwait were the reason for the March output increase, far outweighing decreases of 100,000 barrels per day from sanctioned Venezuela, 52,000 barrels per day from sanctioned Iran, and 54,000 barrels per day from wartorn Libya . But except for the increases from the three Saudi allies, it appears that most other OPEC members continued to adhere to the output allocations that were originally determined for each OPEC member after their December 7th, 2018 meeting, when OPEC agreed to cut 800,000 barrels per day as part of a 1.2 million barrel per day cut agreed to with Russia and other oil producers and the additional production cuts of 500,000 barrels per day through to March 2020 that were announced at their December 6th, 2019 meeting..
The next graphic from the report that we'll include shows us both OPEC and world oil production monthly on the same graph, over the period from April 2018 to March 2020, and it comes from page 46 (pdf page 56) of the March OPEC Monthly Oil Market Report.. On this graph, the cerulean blue bars represent OPEC oil production in millions of barrels per day as shown on the left scale, while the purple graph represents global oil production in millions of barrels per day, with the metrics for global output shown on the right scale...
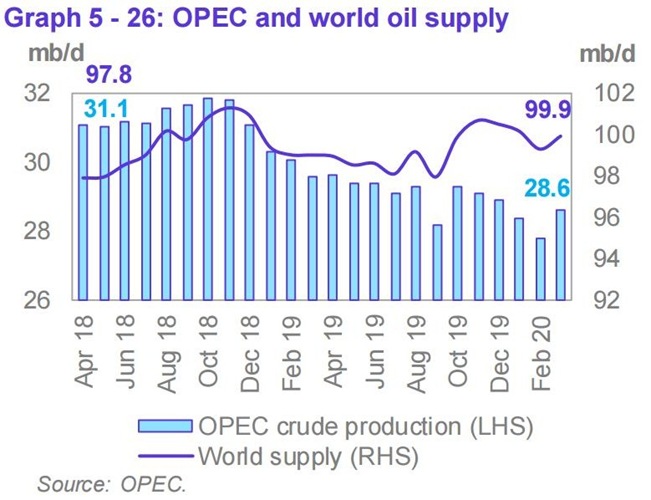
Due to the 821,000 barrel per day jump in OPEC's production from what they produced a month ago, OPEC's preliminary estimate indicates that total global oil production increased by a rounded 0.62 million barrels per day to average 99.86 million barrels per day in March, a reported increase which apparently came after February's total global output figure was revised lower by 510,000 barrels per day from the 99.75 million barrels per day of global oil output that was reported a month ago, as non-OPEC oil production fell by a rounded 200,000 barrels per day in March after that revision, with lower oil production from the OECD Americas, Norway, Brazil and Kazakhstan the major reasons for the non-OPEC output decrease in March. With the increase in March's global output, the 99.86 million barrels of oil per day produced globally in March were 1.11 million barrels per day, or 1.1% greater than the revised 98.75 million barrels of oil per day that were being produced globally in March a year ago, the 3rd month of OPECs first round of production cuts (see the April 2019 OPEC report (online pdf) for the originally reported February 2019 details). With this month's upward revision to and increase in OPEC's output, their March oil production of 28,612,000 barrels per day rose to 28.7% of what was produced globally during the month, up from the 28.1% share OPEC contributed in February, and the 28.3% global share they had in January. OPEC's March 2019 production, which included 524,000 barrels per day from former member Ecuador, was reported at 30,022,000 barrels per day, which means that the 13 OPEC members who were part of OPEC last year produced 886,000 fewer barrels per day of oil in March than what they produced a year ago, when they accounted for 30.2% of global output, with a 1,003,000 barrel per day drop in the output from Libya and a 680,000 barrel per day drop in the output from Iran only partially offset by a 392,000 barrel per day increase in the output from the Emirates, a 266,000 barrel per day increase in output from Saudi Arabia, and smaller year over year increases in the output from Kuwait and Nigeria...
With the big jump in OPEC's output that we've seen in this report, there was a substantial surplus in the amount of oil being produced globally during the month, as this next table from the OPEC report will show us...

The above table came from page 25 of the April OPEC Monthly Oil Market Report(pdf page 35), and it shows regional and total oil demand estimates in millions of barrels per day for 2019 in the first column, and OPEC's estimate of oil demand by region and globally quarterly over 2020 over the rest of the table.. On the "Total world" line in the second column, we've circled in blue the figure that's relevant for March, which is their estimate of global oil demand during the first quarter of 2019...
OPEC is estimating that during the 1st quarter of this year, all oil consuming regions of the globe have been using an average of 92.92 million barrels of oil per day, which is a 4.66 million barrel per day downward revision from the 97.58 million barrels of oil per day they were estimating for the 1st quarter a month ago (circled in green), largely reflecting coronavirus related demand destruction. Meanwhile, as OPEC showed us in the oil supply section of this report and the summary supply graph above, OPEC and the rest of the world's oil producers were producing 99.86 million barrels per day during March, which would imply that there was a surplus of around 6,940,000 barrels per day in global oil production in March when compared to the demand estimated for the month...
However, as we know, most of that downward revision in 1st quarter demand was due to shutdowns and lockdowns imposed worldwide during the month of March, as the economic and fuel consumption impacts during February were mostly limited to China and Korea. That means to get a reasonable idea of what the impact of the reduced demand metric implies, we'll have to recompute the oil production figures for the first quarter as a whole, and then make our own estimates as how those apply to each month, based on what we know about the impact of the coronavirus...
As we saw earlier, February's global oil output was revised lower by 510,000 barrels per day to 99.24 million barrels per day with this report, while January's global oil output was revised to 100.04 million barrels per day with last month's OPEC report. Since this month's report indicates that March's global oil output was at 99.86 million barrels per day, that means global oil output for the first quarter averaged 99.724 million barrels per day. Given OPEC's global demand estimate of 92.92 million barrels of oil per day, we can therefore estimate with reasonable accuracy that there was a surplus of around 6,800,000 barrels per day in global oil production over the first quarter when compared to the demand estimated for the quarter...
Now it gets tricky. Since the virus was largely confined to China during January, and Chinese authorities had not even admitted to human to human transmission until January 20th, we can figure the impacts of the virus outbreak on global fuel consumption were negligible during January. Hence, we'll take our original estimate of a surplus of 610,000 barrels per day in global oil production during January and adjust it for the revisions to global production reported in February to estimate that there was a global surplus of 690,000 barrels per day in global oil production during January. Next, since we have no new information as to the impacts of the virus outbreak in February, we'll use our estimate from last month's OPEC data that there was a surplus of around 2,170,000 barrels per day in global oil production in February, and adjust it with the 510,000 barrels per day downward revision to global output reported this month to estimate that February's surplus oil production was at 1,660,000 barrels per day during the month. Then, backing those oil surplus figures for January and February out of the first quarter's oil production surplus of 6,940,000 barrels per day leaves us with nearly 550 million barrels of surplus oil in March, or an average surplus during the month of around 17,718,000 barrels per day. That means the supply of oil exceeded the demand for it by nearly 19%
Given that massive surplus for March, what can we expect in the future in light of last week's OPEC pact with Russia and other major producers to cut production by 9.7 barrels per day over May and June? to explain what's in play for the next three months, we'll start by including a table of the production cuts each of the participants in last week's meeting agreed to...

The table above came from an article at Zero Hedge, and it shows the oil production baseline in thousands of barrel per day, from which each of the oil producers will cut from in the first column, a number which is based on each of the producer's October 2018 output, ie., a date before the past year's and past quarter's output cuts took effect; the second column shows how much each participant will cut in thousands of barrel per day, which is 23% of the October 2018 baseline for all participants except for Mexico, while the last column shows the production level each participant has agreed to after that 23% cut..
Using October 2018 as a basis for their cuts means they're not actually cutting 23% from recent production, because almost all of these producers had higher production back then than they do now. If you simply go back to the first OPEC table we've included here (Table 5-8), you can see that OPEC's production in 2018 was at 31,344,000 barrels per day, 12.8% more than their pre-price war February production of 27,790,000 barrels per day. When we check OPEC's October 2018 production on a similar table from their November 2018 report, we find it was the highest of that year, in fact the highest in 3 years, at 32,965,000 barrels per day, so it begins to look like they cherry-picked that baseline to make it seem their new cuts are more than they actually are.....
Moreover, Iran, Libya and Venezuela, whose production has recently been beaten down, are not even required to make any cuts. If we were to add the October 2018 production from Iran, Libya and Venezuela back to OPEC's "proposed voluntary cut level" of 20,599,000 barrel per day, we'd find that OPEC's May and June production could be as high as 26,185,000 barrels per day, down just 5.8% from their pre-price war production of 27,790,000 barrels per day. So the widely promoted "10 million barrel per day" production cuts are just a deception, designed to underpin oil prices and keep them from falling to a level that would reflect the actual supply demand imbalance....
We find that by excluding whatever Iran, Libya and Venezuela produce, the other OPEC members will be voluntarily reducing their production 15% from their pre-price war levels. Then, outside of OPEC, there are really only 3 producers who's cuts have the potential to make a difference on a global scale; Russia, Kazakhstan, and Mexico, so we'll check their recent production to see how much they're really cutting their output. According to page 43 of the April OPEC Monthly Oil Market Report, Russia's crude oil production was at 10.58 million barrels per day in both February and March, so their "proposed voluntary cut level" of 8,492,000 barrels per day is a 19.7% cut from their current production level. Next, according to page 44 of the April OPEC Monthly Oil Market Report, Kazakhstan's February production level was at 1.65 million barrels per day (their March output is not given), so their "proposed voluntary cut level" of 1,319,000 barrels per day represents a 20% cut from their February production. And for Mexico, page 44 of the April OPEC Monthly Oil Market Report shows their February production level was at 1.73 million barrels per day (again, March is not given), so their "proposed voluntary cut level" of 1,653,000 barrels per day represents a 5.5% cut from what they were producing in February (note that Mexico is a special case, because they are so heavily hedged by buying oil puts that they stand to make more on their hedges if oil prices fall than they'll lose in selling their oil below cost, so they have no incentive to cut production; hence, OPEC simply had to accept what they offered, or they'd walk away..)
So, given the reality of the much ballyhooed production cuts, let's try to estimate what the 2nd quarter supply / demand balance might be. Back on Table 4-2 above, “World Oil Demand in 2020”, we've also circled in red the figure that's relevant for the 2nd quarter on the "Total world" line in the third column. OPEC has estimated that during the 2nd quarter, global consumption of oil will be at an 86.70 million barrels of oil per day average, which is a 11.50 million barrel per day downward revision from the 98.20 million barrels of oil per day they had estimated or the 2nd quarter a month ago. Since April was half gone before the ink was dry on this most recent production cut agreement, we see no reason that OPEC's April production will fall from March levels; indeed, it may even rise, considering that the Saudis, the Emirates, & Kuwait were engaged in an all-out production & price war at the beginning of the month. But we’ll just use March's OPEC output figures for April to simplify our estimate. Then we'll also estimate that oil production will fall by 1 million barrels per day for producing countries other than OPEC, largely on cutbacks to expensive US shale and Canadian tar-sands production, due to depressed oil prices. Hence, that would leave April's global oil production at 98.86 million barrels per day. Then in May, these OPEC+ production cuts that we've been discussing kick in. Rather than the advertised 9.7 million barrels per day cut, we've figured that they'll actually be closer to 7.2 million barrels per day lower than what the same countries produced in February (if they meet their "voluntary" targets). Again, generously estimating that oil production will again fall by 1 million barrels per day for other producing countries not included in the OPEC pact would leave May's global oil production at 89.86 million barrels per day (temporarily accepting more significant digits than our data warrants). Since we have no special insight into what might happen to oil prices by June, we'll just repeat May's production figure of 89.86 million barrels per day as our estimate for June. That gives us an average oil production figure of 92.86 million barrels per day for the 2nd quarter, against OPEC’s demand estimate of 86.70 million barrels per day, suggesting that even after Russian & OPEC production cuts, 2nd quarter global production will still be 6,160,000 barrels per day greater than demand. Since the OPEC-led production cut pact is for just two months of the quarter, OPEC and its partners would have to cut another 9.24 million barrels per day – 27% of their already reduced production - to balance 2nd quarter supply and the projected demand…
note: the above was excerpted from my weekly oil & gas synopsis at Focus on Fracking…
Comments
Yoozer
This is truly astounding that they didn't cut production originally. Denial!