
The S&P Case Shiller home price index shows a -3.4% decline from a year ago over 20 metropolitan housing markets and a -3.0% decline for the top 10 housing markets from October 2010. Home prices are back to early 2003 levels.
Below is the yearly percent change in the composite-10 and composite-20 Case-Shiller Indices. These are not seasonally adjusted, but comparing from October 2010.

Wondering why we have conflicting news headlines on the S&P Case-Shiller Housing Index? Because some in the press use the seasonally adjusted data, and others do not. S&P themselves use the not seasonally adjusted numbers for their headlines and press releases. To make matters worse, some compare just the monthly not seasonally adjusted data and others compare the housing price index to one year ago, without telling you what number they are quoting from S&P. That's why on this site we make sure you know which apple you're looking at, all data is identified.
This month the not seasonally adjusted September to October change for the composite-20 was -1.2%. The seasonally adjusted composite-20 monthly change was -0.6%. The composite-10 not seasonally adjusted monthly change was -1.1% and the seasonally adjusted composite-10 monthly change was -0.5%. Intuitively, the divergence of the seasonal adjustments in October makes sense. The housing season is over. Bottom line, anyway you look at the Case-Shiller numbers, single family housing prices decreased.
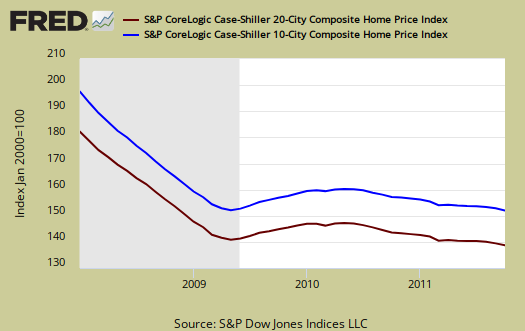
The above graph shows the composite-10 and composite-20 city home prices indexes, seasonally adjusted. Prices are normalized to the year 2000. The index value of 150 means single family housing prices have appreciated, or increased 50% since 2000 in that particular region. These indices are not adjusted for inflation. The composite-20 index, seasonally adjusted is 138.56 and comparable to March 2003 levels (ignoring 2009). Not seasonally adjusted the composite-20 index is 140.30, equal to May 2003 levels. Seems every month we go backwards in time and housing still is not aligned with the reality of repressed middle class income.
The S&P/Case-Shiller Home Price Indices are calculated monthly using a three-month moving average and published with a two month lag. Their seasonal adjustment calculation is the standard used for all seasonal adjustments, the X-12 ARIMA, maintained by the Census.
So, why would S&P report the not seasonally adjusted data? According to their paper on seasonal adjustments, they claim the not seasonally adjusted indices are more accurate. Why? It appears the housing bubble burst screwed up the cyclical seasonal pattern. What a surprise.
The turmoil in the housing market in the last few years has generated unusual movements that are easily mistaken for shifts in the normal seasonal patterns, resulting in larger seasonal adjustments and misleading results.
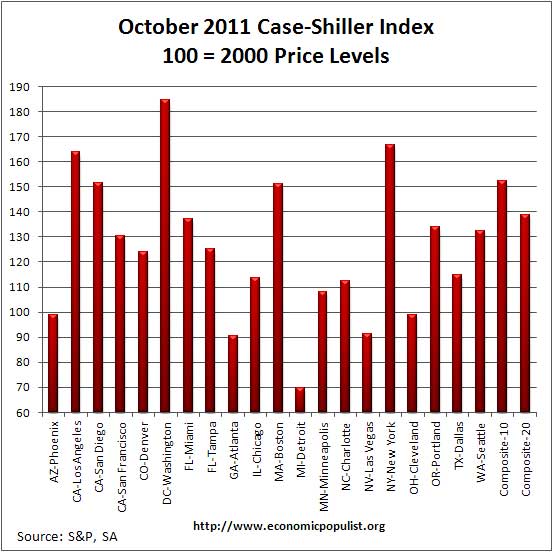
Not seasonally adjusted data creates more headline buzz on a month by month basis. S&P does make it clear that data should be compared to a year ago, to remove seasonal patterns, yet claims monthly percentage changes should use not seasonally adjusted indices and data. This seems invalid for housing markets are highly seasonal. Below are the seasonally adjusted indices for October 2011.
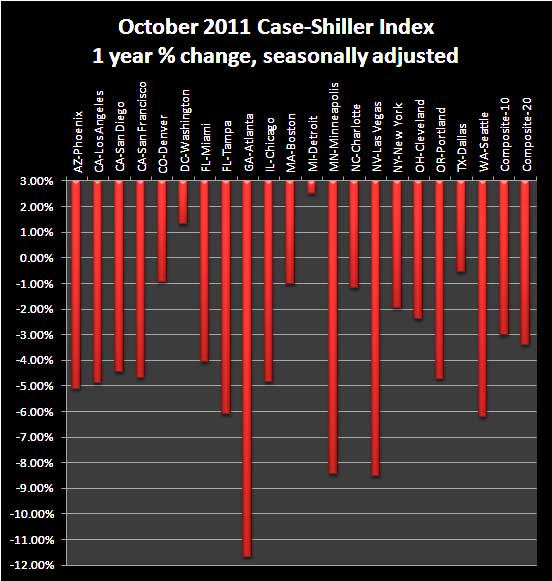
For October 2011, the S&P/Case-Shiller Home Price indexes, seasonally adjusted, shows 18 of the 20 cities tracked are down for the year. Detroit, had the best yearly increase, 3.50%, but bear in mind they have been hammered. Atlanta is down -11.66% from a year ago.
Below are all of the composite-20 index cities yearly price percentage change, using the seasonally adjusted data.
When it comes to annual data, the seasonally adjusted and not seasonally adjusted should start to converge. Here is S&P's comment on their figures, using the not seasonally adjusted data. Notice where the jobs are not is where prices are decreasing.
Atlanta and the Midwest are regions that really stand out in terms of recent relative weakness. Atlanta was down 5.0% over the month, after having fallen by 5.9% in September. It also has the weakest annual return, down 11.7%. Chicago, Cleveland Detroit and Minneapolis all posted monthly declines of 1.0% or more in October. These markets were some of the strongest during the spring/summer buying season. However, Detroit is the healthiest when viewed on an annual basis. It is up 2.5% versus October 2010. Atlanta, Cleveland, Detroit and Las Vegas are four markets where average prices are below their January 2000 levels; and Atlanta and Las Vegas posted new lows in October.
Calculated Risk, has additional custom graphs and data analysis and is the uber site for residential housing, with valid statistical analysis.
S&P does a great job of making the Case-Shiller data and details available for further information and analysis on their website.
Recent comments