
The March unemployment report on the surface looked bad due too less than one hundred thousand jobs gained. But that is just one number and also not part of the report which calculates the unemployment rate and other statistics. The unemployment rate actually dropped -0.2 percentage points to 4.5%. That in itself is a decade low. The better news is the monthly drop was due to less people being unemployed and almost half a million more were working.

This article overviews and graphs the statistics from the Employment report Household Survey also known as CPS, or current population survey. The CPS survey tells us about people employed, not employed, looking for work and not counted at all. The household survey has large swings on a monthly basis as well as a large margin of sampling error. This part of the employment report is not about actual jobs gained, as reported by businesses, but people and their labor status.
Those employed number 153,000,000, a 472,000 increase from the previous month. From a year ago, the ranks of the employed has increased by 1.699 million. Most of the annual gains have happened in the last two months. The annual gain is just around what is required to keep up with new population growth.

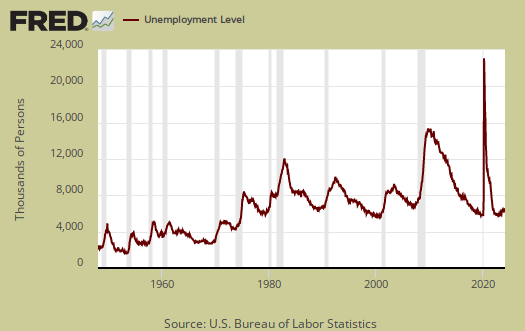
Those officially unemployed is 7,977,000, a shocking -326,000 monthly drop. From a year ago the unemployed has decreased by −775,,000, which is quite a bit considered the official unemployed is only 8 million.
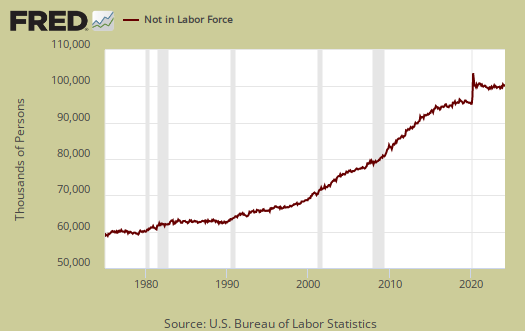
Those not in the labor force is 94,213 million. The below graph are the not in the labor force ranks. Those not in the labor force insignificantly gained by 23,000 for the month and from a year ago, a 723 thousand person increase. Previously we showed this figure cannot be all baby boomers retiring and magically more going to college but now this figure could be just that.
The labor participation rate is 63.0%, which is still terrible and unchanged from last month. Pre-recession, the January 2008 labor participate rate was 66.2% and one must remember the job market was not good then.

Below is a graph of the labor participation rate for those between the ages of 25 to 54. The rate is now 81.7% which is no change from last month. Ages 25-54 are the prime working years where people are not in retirement or in school full time as commonly as other age groups, so seeing this rate recover implies people really are getting jobs. In January 2008 the prime working years labor participate rate was 83.3%.

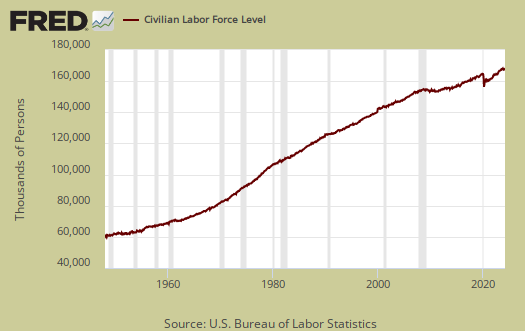
The civilian labor force, which consists of the employed and the officially unemployed is 160,201,000. The civilian labor force has grown by 923,000 over the past year. The BLS counts those on guest worker Visas and even illegal workers mixed in with permanent resident and citizen workers in their statistics.
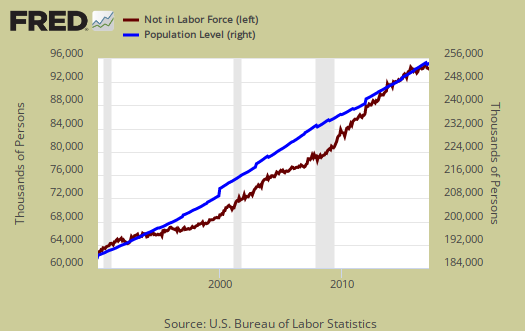
Below is a graph of those not in the labor force, (maroon, scale on the left), against the noninstitutional civilian population (blue, scale on the right). Notice how those not in the labor force crosses the noninstitutional civilian population in growth. The civilian noninstituitonal population is from where all other labor statistics have sprung.
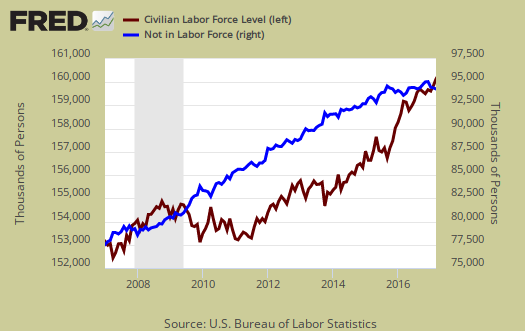
Below is a graph of the civilian labor force, or the official employed plus unemployed, in maroon, scale on left, against those not in the labor force, in blue, scale on right. See how those not in the labor force as a trend exceeded those considered employed and unemployed starting around mid 2009. Starting in 2014 it has reverted back, yet it oscillates starting in 2015. To have a solid employment situation those not in the labor force should be growing less than those obtaining jobs and being counted as looking for work. Those not in the labor force does include retirees and students and there is a baby boomer bump in both of these population groups.
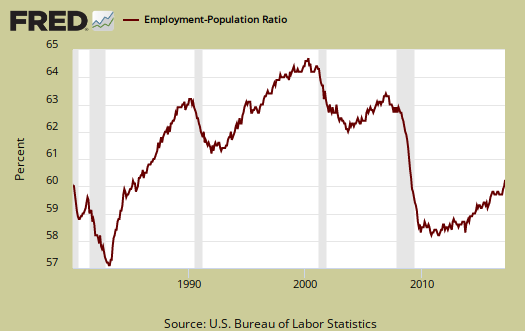
Those considered employed as a ratio to the total Civilian noninstitutional population is 60.0%, which is no change from last month In January 2008, this figure was 62.9%. The relationship between the employment-population ratio and the labor participation rate (LPR) is: employment-population ratio = LPR * (1 - unemployment rate).
March shows some much brighter statistics in the CPS versus the jobs report. Other news was an across the board drop in part time workers and even those marginally attached to the labor force declined. Here are our past overviews CPS unemployment statistics, only graphs revised.
Recent comments