
Although Robert already covered New Home Sales for June earlier this week, I think it’s worth looking at in greater depth, because this report typically has the largest margin of error and is subject to the largest revisions of any census construction series, with the sample data collected from voluntary questionnaires at just a small sampling of permit offices. And as this and other widely followed census residential series are almost never reported with the caveat that they're inexact and error prone, and since they're believed to influence policy, we must continue to explain in detail what little data they reveal.
According to the Census, June sales of new single family homes were estimated to be "at a seasonally adjusted annual rate of 497,000, 8.3 percent (±20.5%)* above the revised May annual rate of 459,000", which means that new home sales could have been down 12.2% from May's sales, or up 28.8%. Furthermore, that range is the 90% confidence interval, which means that census figures there's even a 1 in ten chance that sales were down more than 12.2% or up more than 28.8% in June. To put numbers on it, it means that census is just 90% confident, that if the pace of new home sales they've estimated in June were to be extrapolated throughout the year, somewhere between 436,366 and 640,136 homes would be sold, and there's a 1 in 10 chance that the annual rate of sales would fall outside that range. The year over year change has a similar wide range of possibilities; at "38.1 percent (±22.0%) above the June 2012 estimate", it means census believes there's a 90% chance that home sales rose between 16.1% and 60.1% since June of last year. Policy makers might get better odds at Vegas...
Before the adjustment and extrapolation, the actual estimate of new homes sold in June was 48,000; which was up from the revised May estimate of 43,000, which in turn was reported last month as 45,000 homes sold, resulting in a 17,000 downward revision in the annualized May rate.. April's estimated sales were also revised down, from the 46,000 revised figure of last month to 44,000, while March sales were revised down from the earlier estimate of 42,000 to 41,000, meaning the net downward revisions in this report were as great as the headline sales gain, which many trumpeted as the highest level of sales in 5 years. Of the estimated 48,000 homes sold in June, an estimated 18,000 were not yet started, 16,000 were under construction, and 13,000 were completed. After the release of this report, housing economist Tom Lawler poured over the 2nd quarter results of the top seven US homebuilders, and in noting a large number of cancellations, opined that there is a good chance that these home sales estimates for last quarter will be revised downward, and that the bulk of the downward revision would be in June sales.
Census also reports here that the median price of all new homes sold in June was $249,700, which was down from the $263,900 median sales price in May, while the average sales price was $295,000, down from May's average of $307,800. However, those figures are also variable and subject to fluctuating revisions; for instance, April's average sales prices was originally reported as $330,800 on the strength of sales of an estimated 4000 new homes for over $750,000; that has since been revised to show just 2000 homes in that highest price bracket, but April's average sales price has now been revised upwards to $336,800..
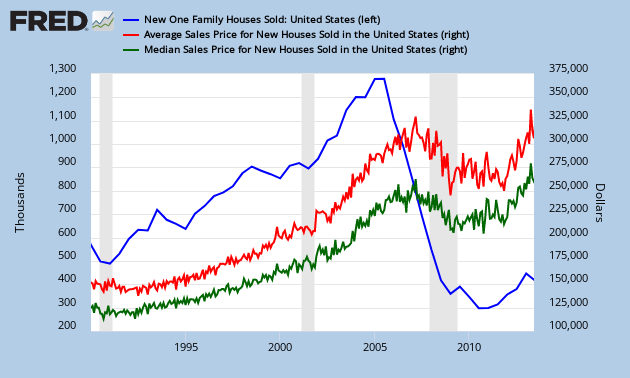
Our FRED graph for this report, above, shows the median monthly new home sales price since 1990 in green, and the monthly track of the average new homes sales price in red. In blue, we've chosen to show the annual rate of new home sales at a the average semiannual rate rather than monthly, to smooth the monthly revisions and eliminate some of the noise in the monthly series. Note that the dollar scale for home prices is on the right of the graph, while the annual home sales rate in thousands is on the left. Clearly this year-to-date's new home sales are above those of the past 4 years, and according to current census data, at the highest rate for a first half year since 2008.
(cross posted from Marketwatch 666)
Comments
check out Alfred
This might be good for the error margins, although they claim the revisions are usual in-between 5%.
Here is Alfred.
Should mention annualization will always gives wild percentages and larger error margins in new home sales.