
The Census, part of the Commerce Department, today released the monthly construction spending report. This is a monthly tally, reported seasonally adjusted, annualized, of how much money was spent on construction. Spending was $808.9 billion in February. The survey has been done since 1960. The below graph shows just how badly construction spending imploded since 2008. Dollars are not adjusted for inflation, so the overall decline is even more dramatic.
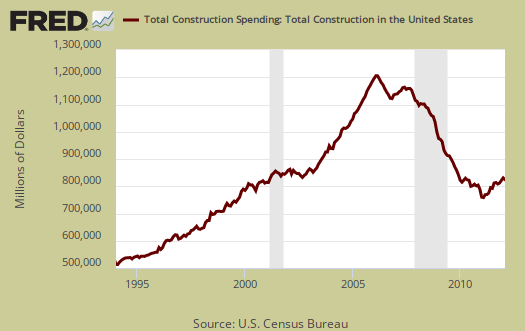
For February construction spending decreased -1.1% from January. Construction has been one of the most decimated sectors from the recession and housing bubble collapse. From this time last year, construction spending is up 5.8%. Taking a two month sum, construction spending is up 7.4%, or $111.3 billion from January and February of 2011 when construction spending was $103.7 billion.
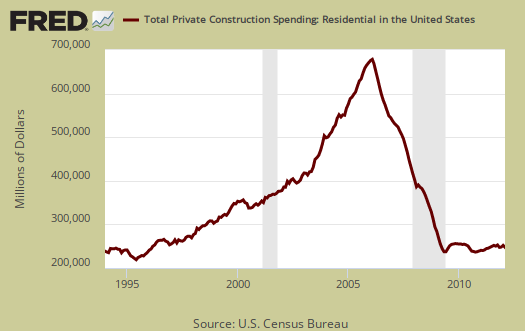
Private construction spending decreased -0.8% overall, with private residential construction having no change from last month. Below is the graph for residential construction spending. One can track the entire housing bubble rise and burst by this graph.
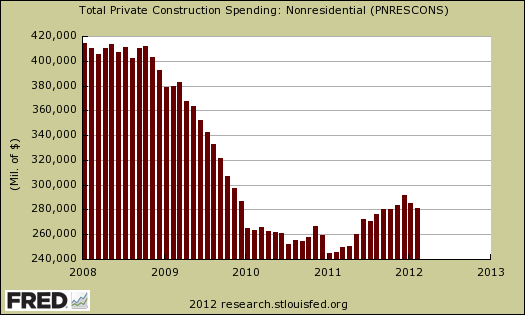
Private, non-residential construction declined -1.6% from January. Commercial private construction was down -3.0%, office building was down -2.6%, lodging declined -2.8% from January, transportation and power both down -2.1% from January. Below is total private nonresidential construction spending, which for February was $527.3 billion.
Public construction spending overall is down -1.7% from January. Below is the report breakdown.
Educational construction was at a seasonally adjusted annual rate of $69.4 billion, 2.5% below the revised January estimate of $71.2 billion. Highway construction was at a seasonally adjusted annual rate of $79.4 billion, 2.6% below the revised January estimate of $81.5 billion.
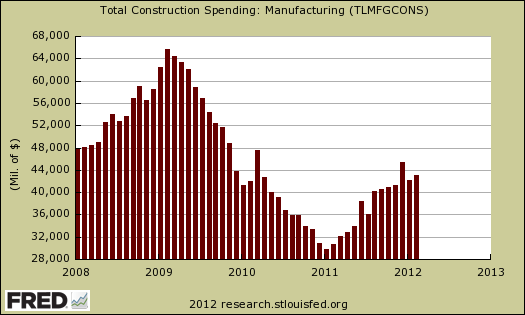
As you know, we here at The Economic Populist love graphs, especially the Saint Louis Federal Reserve FRED tools. FRED has a host of construction spending graphs by individual sectors. Covered is spending on highways, sewers, commercial, manufacturing, water supply and so on.
For example, below are the details of all manufacturing construction spending, both public and private. This month manufacturing construction was the one bright spot of this report, up 2.2% from January and an astounding 40.3% from February 2011 at annualized rates. In the below graph we can also see manufacturing construction was also decimated from the Great Recession.
Power construction, despite declining this month is another bright spot, up 22.1% from February 2011.
As an economic report, this data is considered minor by analysts and economists, yet when one really looks at the series over time, it shows how investment, construction, especially residential real estate, imply future growth.
Recent comments