
If is official. It happened. First quarter 2015 real GDP just went negative with a -0.7% contraction. Remember folks, two consecutive quarters of negative growth can make up an official recession. In reality the revision is a one percentage point slide. Psychologically speaking, contraction isn't too swift as it often pricks bubble minds that blow hot air all over as they deflate. The reason for the negative revision is imports. This is no surprise as imports are often under estimated in the advance report since data hasn't come in yet and our government is in perpetual denial on how trade deficits stunt economic growth. Investment was revised significantly downward as well. Bottom line, this is not a report to ignore.

As a reminder, GDP is made up of: where Y=GDP, C=Consumption, I=Investment, G=Government Spending, (X-M)=Net Exports, X=Exports, M=Imports*. GDP in this overview, unless explicitly stated otherwise, refers to real GDP. Real GDP is in chained 2009 dollars.
The below table shows the GDP component revision comparison from the advance report. Lest we forget, trade data is always delayed and we believe imports will be revised much higher, potentially causing a Q1 GDP contraction.
| Comparison of Q1 2015 Advance Estimate and 1st Revision GDP Components | |||
|---|---|---|---|
|
Component |
Q1 2015 Advance |
Q1 2015 Revision |
Spread |
| GDP | +0.25 | -0.75 | -1.00 |
| C | +1.31 | +1.23 | -0.08 |
| I | +0.34 | +0.12 | -0.22 |
| G | -0.15 | –0.20 | -0.05 |
| X | -0.96 | -1.03 | -0.07 |
| M | -0.29 | –0.87 | -0.58 |
Tthe below table shows the GDP component comparison in percentage point spread from Q4 to Q1. As we can see consumer spending really dropped in Q1 as did exports.
| Comparison of Q1 2015 and Q4 2014 GDP Components | |||
|---|---|---|---|
|
Component |
Q1 2015 |
Q4 2014 |
Spread |
| GDP | -0.75 | +2.21 | -2.96 |
| C | +1.23 | +2.98 | -1.75 |
| I | +0.12 | +0.61 | -0.49 |
| G | -0.20 | –0.35 | +0.15 |
| X | -1.03 | +0.59 | -1.62 |
| M | -0.87 | –1.62 | +0.75 |
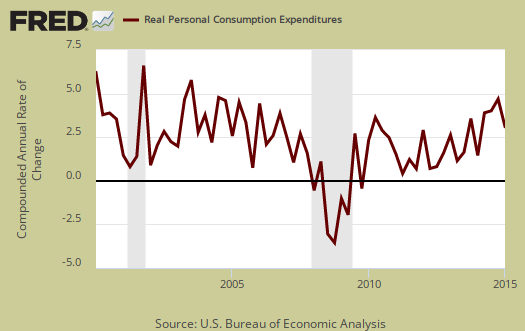
Consumer spending, C is the engine of the economy so this is quite the bad sign in terms of demand. Durable goods was a 0.10 percentage point contribution with motor vehicles & parts being -0.10 percentage points. Consumer spending services added 1 13 percentage points with health care by itself adding 0.60 percentage points to GDP. Health care was more than housing. Spending to house oneself and corresponding utilities was a 0.67 percentage point GDP contribution. Below is a percentage change graph in real consumer spending going back to 2000.
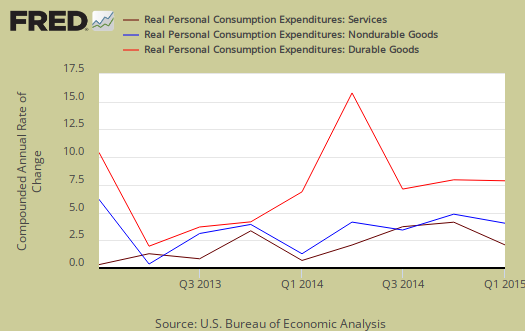
Graphed below is PCE with the quarterly annualized percentage change breakdown of durable goods (red or bright red), nondurable goods (blue) versus services (maroon). When the economy is doing poorly the first thing to go is spending on durables.
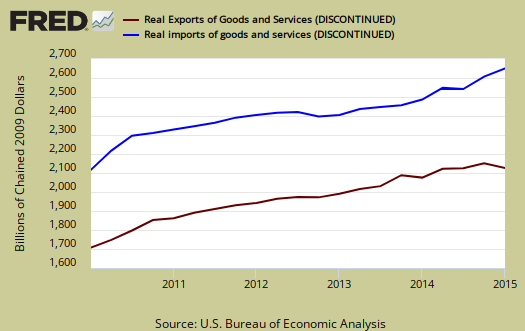
Imports and Exports, M & X slammed Q1 GDP with a -1.90 percentage point subtraction. That's almost two percentage points just due to the trade deficit and America is supposedly importing a lot less oil these days. Our elected representatives continue to ignore the trade deficit and pass even more corporate written bad trade deals which leave the economy, American worker and consumer in the dust.
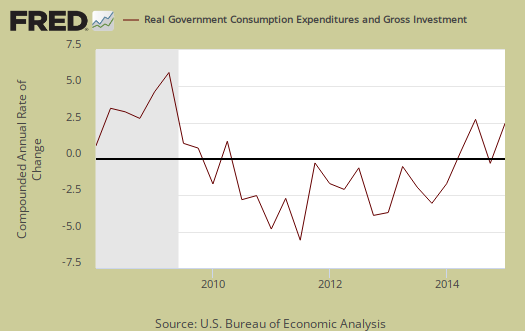
Government spending, G contributed –0.20 percentage points to Q1 GDP. State and local governments lack of spending took off -0.21 real GDP percentage points and they contracted -0.27 percentage points in investment, ouch. No repaired and safe bridges coming to a road near you anytime soon one would guess from these figures.
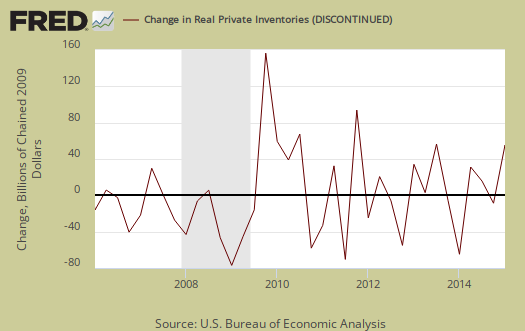
Investment, I is made up of fixed investment and changes to private inventories. Investment contributed a measly 0.12 percentage points to Q1 GDP. The change in private inventories alone was revised significantly down, from 0.74 to a 0.33 percentage point contribution. Changes in inventories is the only thing which saved investment that quarter. Below are the change in real private inventories and the next graph is the change in that value from the previous quarter.

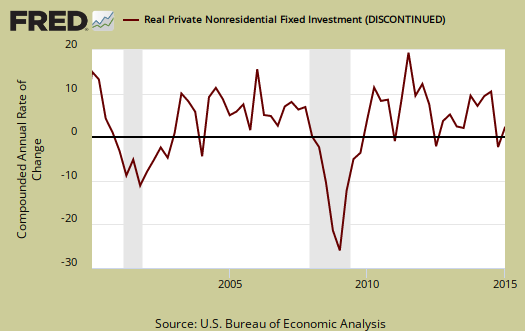
Fixed investment is residential and nonresidential and was revised to -0.21 from a -0.40 percentage point GDP contraction. Nonresidential structures simply imploded with a -0.67 individual percentage point contraction. Transportation equipment gave a percentage point contribution of 0.22. Intellectual property products was revised down to 0.14 from 0.30 percentage points, but one must wonder how that is when so often intellectual property is parked in special purpose vehicles located in the Caymans and other tax havens.
Residential fixed investment was revised up to 0.16 from 0.04 percentage points to Q1 GDP. The below graph of residential fixed investment really shows the housing bubble and despite housing prices rise, notice the lack of economic growth contribution of residential fixed investment.

Nominal GDP: In current dollars, not adjusted for prices, of the U.S. output,was $17,665.0 billion, a -0.9% annualized decrease from Q4. In Q4, current dollar GDP increased 2.4%.

Real final sales of domestic product is GDP - inventories change. This figures gives a feel for real demand in the economy. This is because while private inventories represent economic activity, the stuff is sitting on the shelf, it's not demanded or sold. Real final sales contracted -1.1%. This is the worst bit of news in the Q1 GDP report.

Gross domestic purchases are what U.S. consumers bought no matter whether it was made in Ohio or China. It's defined as GDP plus imports and minus exports or using our above equation: where P = Real gross domestic purchases. Real gross domestic purchases increased 1.1% in Q1. Exports are subtracted off because they are not available for purchase by Americans, but imports, of course are available for purchase in the U.S. When gross domestic purchases exceed GDP, that's actually bad news, it means America is buying imports instead of goods made domestically.

The price index for gross domestic purchases plunged -1.6% on oil. Without food and energy considered, the core price index increased 0.2%. Below is the price index for gross domestic purchases.

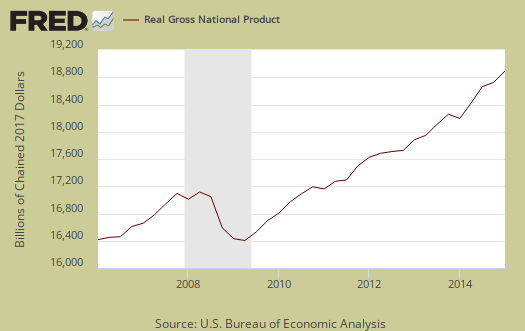
GNP - Gross National Product: Real gross national product, GNP, is the goods and services produced by the labor and property supplied by U.S. residents.
GNP = GDP + (Income receipts from the rest of the world) - (Income payments to the rest of the world)
Real GNP declined by -1.4% for Q1. In Q4 GNP increased 1.4%. GNP includes, whereas GDP excludes, net income from the rest of the world. GNP increases beyond GDP if Americans made out like bandits from foreign investments more than foreigners cashed in on investments within the U.S. borders.
GDI - Gross Domestic Income: Gross Domestic Income is all income from within the borders of a nation and should normally equal GDP. GDI is wages, profits & taxes minus subsidies. Real GDI was 1.4% in Q1. Q4 GDI was a 3.7% increase. The BEA says GDI measures the economic output as the costs incurred as well as incomes earned in the production of GDP. The BEA also states GDI can have statistical discrepancy over short time periods.

Below are the revised percentage changes of Q1 2015 GDP components, from Q4. Here we see that exports truly imploded from last quarter. There is a difference between percentage change and percentage point change. Point change adds up to the total GDP percentage change and is reported above. The below is the individual quarterly percentage change, against themselves, of each component which makes up overall GDP. Additionally these changes are seasonally adjusted and reported by the BEA in annualized format.
|
Q1 2015 GDP Component Percentage Change (annualized) |
|||
|---|---|---|---|
| Component | Percentage Change from Q4 | ||
| GDP | -0.7% | ||
| C | +1.8% | ||
| I | +0.7% | ||
| G | -1.1% | ||
| X | -7.6% | ||
| M | +5.6% | ||
Overall, this is just a horrific report. We'll be looking very closely at how Q2 is shaping up but so far, it ain't too swank. This report shows simply very weak economic demand.
Other overviews on gross domestic product can be found here. The BEA GDP site is here.
i disagree with the BEA revisions
i still have a problem with these revisions...recall that our imports jumped in March when the West coast dock strike ended and the ships were unloaded, and as a result the March trade deficit increased 43%...however, those imports did not show up in March business sales, business inventories, or even in investment...so while BEA applied their GDP formula to subtract imports from 1st quarter GDP, the reason imports are subtracted from GDP is because they represent consumption inventories or investment that was previously added to GDP that was not produced in the US...considering that those imports dont seem to have been added to any of the other national accounts, they shouldn't subtract from GDP...where they went is still a mystery, perhaps they'll show up in consumption or inventories in the 2nd quarter, but from here it appears that the subtraction of the March jump in imports was misallocated by the GDP model...
rjs
hmmmmm
I think you are missing exports in this equation. I don't see an unusual bump in imports. This is standard fare and I warned about it with the advance. The inputs come in from the Census and are reported about this time but the adjustment up is not unusual at all, looks like your typical importa adjustment figures, happens every quarter and deflates GDP accordingly.
don't see it being due to a strike, one time event.
You know with seasonal adjustments they have strike and unusual event adjustments?
exports and imports
nope, never heard of unusual event adjustments...one would think if they made such an adjustment it would have been included in the technical notes; as it is, the 2nd estimates technical notes link still goes to the advance estimate notes...
exports were revised, but they weren't the major revision...real exports fell at a 7.6% rate rather than the 7.2% contraction reported in the first estimate, while the real growth of our imports was revised to 5.6% from the previously reported 1.8% growth...i know the formula says to subtract imports from exports, but the formula is misleading...exports must be added to GDP because they are US goods and services not counted elsewhere...imports only subtract from GDP because they were added to consumption, investment, or inventories of another GDP component...if they werent added, they shouldnt subtract...
rjs
what?
I have no idea what you are saying at this point. Of course imports are subtracted because that IS U.S. consumption and/or U.S. inventories NOT made in the United States, not domestic. Perhaps you think of GNP? Also, if the strike was that influential, don't you think that exports would also be anomalies since they too go out through West coast ports? True, China comes in through long beach primarily but they also come in all through the borders. They use ports in Mexico and Canada and are then delivered by truck.
I haven't done it but Alfred can show if the revision to imports is unusual. I don't think it is at all.
It is a large revision to imports but it's not that unusual, case in point here, Q4 2014 and no strike involved.
Also, the BEA did mention the West coast port labor dispute, here.
resolution of March imports
when i went through the itemized list of March imports i noted that imports of consumer goods rose by $9,013 million to $54,164 million with a $1,677 increase in imports of cell phones and similar household electronics, a $1,293 increase in imports of synthetic textiles, and a $981 million increase in our imports of furniture and similar household goods..in addition, our imports of cotton apparel and household goods, footwear, pharmaceutical preparations, toys, games, and sporting goods, televisions and video equipment. other consumer nondurables, non textile apparel and household goods, household appliances cookware, cutlery, tools, and camping apparel and gear all also rose by more that $250 million each…those increases almost certainly did not indicate an increase in consumption of consumer goods by that much, but rather just an offloading of ships…there were similar increases in every other catagory of imports except petroleum and similar industrial supplies…
since those goods were not consumed, i expected they’d show up as an increase in wholesale or retail inventories…but they did not show up in March business sales, business inventories, or anywhere in investment…so while BEA applied their GDP formula to subtract imports from 1st quarter GDP as they normally would, the reason imports are subtracted is because they represent consumption, inventories, or investment that were previously added to GDP that shouldnt have been because they were not produced here…considering that those March imports don’t seem to have been added to any of the other national accounts, i contend they shouldn’t subtract from GDP (at least not in this quarter)…imports should only subtract insofar as they were counted as output of goods and services in another national account..
exports, revised or not, are clearly an addition to our output not captured in consumption or investment so they obviously must be added...
i wouldnt have given imports a second thought if i hadnt seen that March spike that didnt show up elsewhere...
rjs
hmmm, more on imports
Perhaps you are confusing a month with a quarter. Also, very often things have been revised while going in as inputs into GDP yet those revisions are not yet published. I just pulled up the trade report and briefly scanned. While the month is wild, it looks to me the quarter itself evened out as February was unusually low. I'd have to calculate it all by hand but eyeball that's what it looks like.
I'm not sure what you mean by inventories popping up for I could be wrong but I would imagine or hope to imagine that imports are a low percentage of U.S. inventories therefore changes to those inventories, by ratios of import changes wouldn't be very much. i.e. imports are say 10% of a business raw materials then a spike up gives a 12% but the previous month is a decline and so on. Overall inventories barely budge to the impact from just imports. Also, low imports in February could mean March imports were never inventories but just replenished. Seriously, it really looks like Q1 the wild months cancelled themselves out on imports.
March revisions
to an extent, i am looking at March in isolation, like i always look at the last month of a quarter for revisions that will give me a clue as to how GDP might be revised...when the Q1 advance report was released, BEA's note was that they assumed an increase in imports and in exports, that wholesale and retail inventories had increased and that nondurable manufacturing inventories had decreased in March...so the next week, the trade data was released and exports were up but imports were a blowout...so i looked at the details of those imports and that's when i realized they couldnt have been consumed in March...many of the import items that were up 20 to 50%, such as cellphones, clothing, footware, furniture and cookware sure didnt see a jump like that in retail sales....so i waited to see if they would show up in inventories next week...but inventories were weak and revised down...so i still think a whole raft of March imports went AWOL in the other national accounts...i expect they'll show up in this quarter, the net effect of which will be a higher Q2 growth rate..
rjs
April inventories
in the business inventories release today, overall inventories were up 0.4%, the most since last May, & retail inventories were up 0.8% in April, the most in a year and a half...
i can't prove it, but i'll bet a lot of those new April inventories, which will boost 2nd quarter GDP,.were unloaded from the ships and counted as imports in March and were largely responsible for the negative Q1 print...
rjs