
First quarter 2015 real GDP is a measly, pathetic 0.2%. That's quite disappointing, and just shavings and crumbs away from contraction. Consumer spending was less than half of the contribution Q4 brought and exports imploded. While some think this is a report to ignore, that economic growth will spring back, we think this is quite a foreboding of bad news.

As a reminder, GDP is made up of: where Y=GDP, C=Consumption, I=Investment, G=Government Spending, (X-M)=Net Exports, X=Exports, M=Imports*. GDP in this overview, unless explicitly stated otherwise, refers to real GDP. Real GDP is in chained 2009 dollars.
Tthe below table shows the GDP component comparison in percentage point spread from Q4 to Q1. Lest we forget, trade data is always delayed and we believe imports will be revised much higher, potentially causing a Q1 GDP contraction.
| Comparison of Q1 2015 and Q4 2014 GDP Components | |||
|---|---|---|---|
|
Component |
Q1 2015 |
Q4 2014 |
Spread |
| GDP | +0.25 | +2.21 | -1.96 |
| C | +1.31 | +2.98 | -1.67 |
| I | +0.34 | +0.61 | -0.27 |
| G | -0.15 | –0.35 | +0.20 |
| X | -0.96 | +0.59 | -1.55 |
| M | -0.29 | –1.62 | +1.33 |
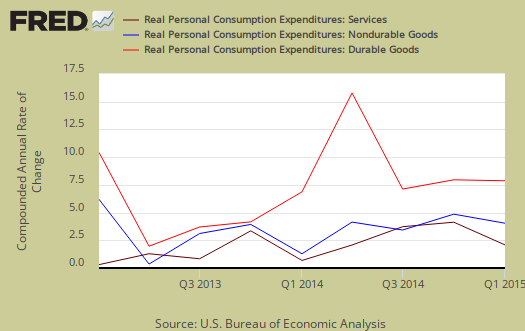
Consumer spending, C was 44% of the Q4 amount. Consumer spending is the engine of the economy so this is quite the bad sign in terms of demand. Durable goods was miniscule, only a 0.05 percentage point contribution as individual sector contributions were flat across the board. Consumer spending services added 1.26 percentage points with health care by itself adding 0.62 percentage points to GDP. That is an enormous amount of spending just on health care. For comparison's sake, spending to house oneself and corresponding utilities was a 0.59 percentage point GDP contribution. Below is a percentage change graph in real consumer spending going back to 2000.

Graphed below is PCE with the quarterly annualized percentage change breakdown of durable goods (red or bright red), nondurable goods (blue) versus services (maroon). This is another horrific sign for when the economy is doing poorly the first thing to do is durable goods spending.
Imports and Exports, M & X slammed Q1 GDP with a -1.25 percentage point subtraction. Exports were-0.96 percentage points as imports were -0.29 percentage points. The worse news of this beyond a significant decline in export demand is trade data always comes in for the next revision to GDP and almost always pulls GDP lower due to imports.

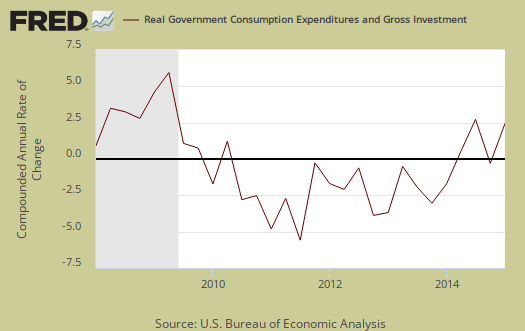
Government spending, G contributed –0.15 percentage points to Q1 GDP, where federal government spending stopped it's hemorrhage with a 0.02 percentage points of GDP. State and local government gross investment took off -0.23 percentage points to real GDP.
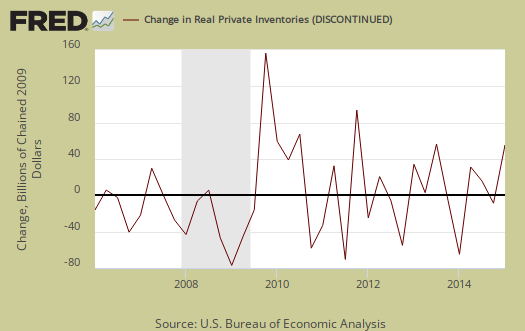
Investment, I is made up of fixed investment and changes to private inventories. Investment contributed 0.34 percentage points to Q1 GDP. The change in private inventories alone was 0.74 percentage point contribution, which saved investment and just shows businesses' increased their inventories. Below are the change in real private inventories and the next graph is the change in that value from the previous quarter.

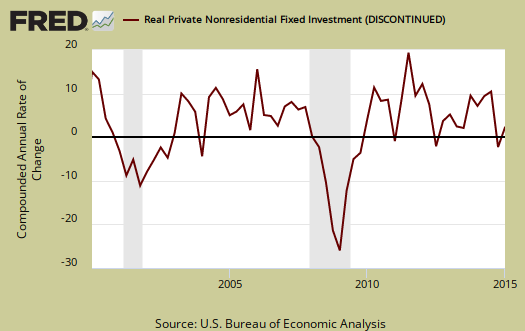
Fixed investment is residential and nonresidential and was a -0.40 percentage point GDP contraction. Nonresidential structures simply imploded with a -0.75 individual percentage point contraction. Transportation equipment gave a percentage point contribution of 0.33. Intellectual property products contributed 0.30 points, but one must wonder how that is when so often intellectual property is parked in special purpose vehicles located in the Caymans and other tax havens.
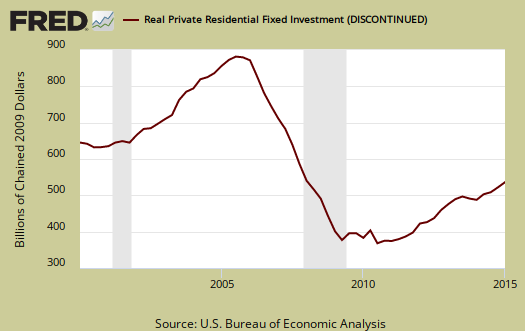
Residential fixed investment added only 0.04 percentage points to Q1 GDP. The below graph of residential fixed investment really shows the housing bubble and despite housing prices rise, notice the lack of economic growth contribution of residential fixed investment.
Nominal GDP: In current dollars, not adjusted for prices, of the U.S. output,was $17,710.0 billion, a 0.1% annualized increase from Q4, a pathetic showing. In Q4, current dollar GDP increased 2.4%.

Real final sales of domestic product is GDP - inventories change. This figures gives a feel for real demand in the economy. This is because while private inventories represent economic activity, the stuff is sitting on the shelf, it's not demanded or sold. Real final sales contracted -0.5%. This is the worst news of this report, that without inventories GDP essentially contracted half a percentage point.

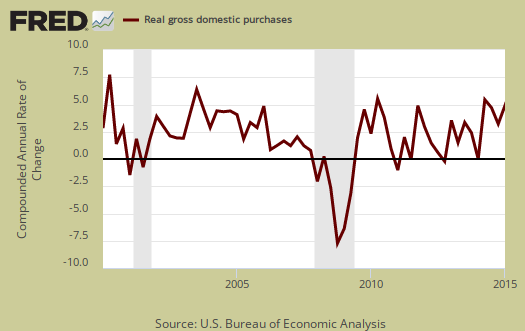
Gross domestic purchases are what U.S. consumers bought no matter whether it was made in Ohio or China. It's defined as GDP plus imports and minus exports or using our above equation: where P = Real gross domestic purchases. Real gross domestic purchases increased 1.5% in Q1. Exports are subtracted off because they are not available for purchase by Americans, but imports, of course are available for purchase in the U.S. When gross domestic purchases exceed GDP, that's actually bad news, it means America is buying imports instead of goods made domestically and this quarter especially it's bad news as most likely all Q1 import data hasn't come in yet.
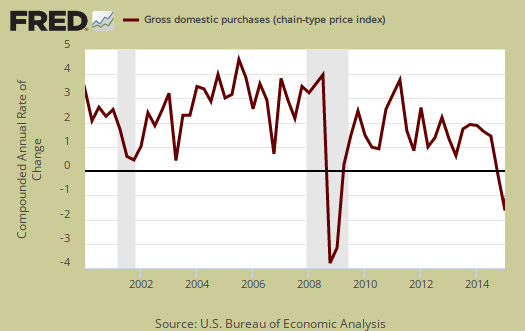
The price index for gross domestic purchases plunged -1.5% on oil. Without food and energy considered, the core price index increased 0.3%. Below is the price index for gross domestic purchases.
Below are the revised percentage changes of Q1 2014 GDP components, from Q4. There is a difference between percentage change and percentage point change. Point change adds up to the total GDP percentage change and is reported above. The below is the individual quarterly percentage change, against themselves, of each component which makes up overall GDP. Additionally these changes are seasonally adjusted and reported by the BEA in annualized format.
|
Q1 2014 GDP Component Percentage Change (annualized) |
|||
|---|---|---|---|
| Component | Percentage Change from Q3 | ||
| GDP | +0.2% | ||
| C | +1.9% | ||
| I | +2.0% | ||
| G | -0.8% | ||
| X | -7.2% | ||
| M | +1.8% | ||
Overall, this is just a horrific report. How Wall street can ignore just an implosion, seemingly from good old fashioned weak demand is beyond us. We should all remember two negative consecutive quarters of GDP signals a recession as we digest the first three months of 2015.
Other overviews on gross domestic product can be found here. The BEA GDP site is here.
baffled by the deflators
the deflator for PCE was negative 2.0%; the deflator for exports was negative 10.0%, the deflator for imports was negative 16.4%, and the deflator for government consumption was negative 1.7%…the only positive deflator was 0.9% for private investment, which is about 15% of GDP…so how they could arrive at a overall GDP deflator of just minus 0.1%?
see table 4: http://www.bea.gov/newsreleases/national/gdp/2015/pdf/gdp1q15_adv.pdf
rjs
GDP Price Indices
The price indexes are change against themselves. GDP price index is ONLY for domestic goods produced in the United States. Whereas other price indexes probably include global sources, etc.
They do not add assuredly, each one is calculated based on different things. Some description is in the NIPA handbook, ch.1-4 but as usual the BEA is not "up front" on these calculates (or is the Census).