
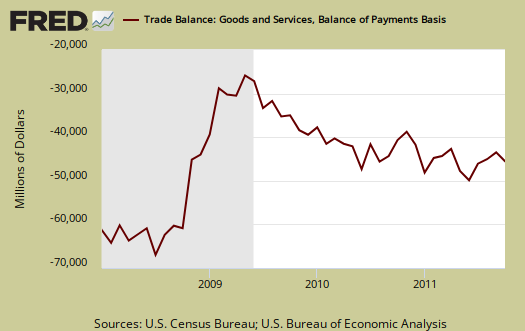
The October 2011 U.S. trade deficit decreased $704 million to $43.48 billion. This is -1.59% drop from last month in the trade deficit. Septembers's trade deficit was revised up from $43.11 billion to $44.17 billion, a $1.06 billion increase. The September trade deficit revision will negatively impact Q3 2011 GDP. Exports decreased $1.45 billion, or -2.44%, while imports decreased $2.15 million, or -0.96%. The goods only trade deficit was $58.784 billion.
Below is the raw customs basis accounting of the trade deficit with China, not seasonally adjusted. China alone was, -$28.07 billion, or 47.38% of the goods trade deficit for October. This includes oil. For comparison's sake the not seasonally adjusted goods trade deficit by Census accounting methods was $60.53 billion.
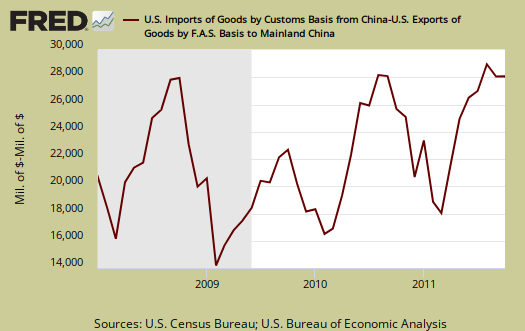
For the 2011 year to date, the trade deficit with China is -$245.45 billion. China is 40.55% of the total goods accumulated trade deficit, which again includes petroleum imports on aggregate. The trade deficit with China for 2011 has already exceeded the October 2010 accumulated China-U.S. trade deficit of -$227.29 billion by $18.16 billion or 7.99%. We have 2 months to go for 2011. The record trade deficit for China of 2010 was $273.06 billion. Assuming a 8% increase, on average of monthly trade deficits with China, we're looking at a potential annual $295 billion 2011 China-U.S. trade deficit, or coming in just shy of $300 billion. Regardless of the psychology of rounding, the U.S.-China trade deficit is guaranteed to exceed last years record.

Oil related imports decreased -$2.22 billion with a petroleum end use trade deficit of $24.39 billion, for October, or 41.49% of the goods trade deficit. This is a -8.36% drop from last month.
By the more specific to import types NAICS codes, not seasonally adjusted, oil and gas were 36.8% of the goods trade deficit, or $21.85 billion. Assuming China has very little oil and gas exports to the United States, if one subtracts off oil and gas from the goods trade deficit, China becomes very roughly 73% of the non-oil and gas goods trade deficit.
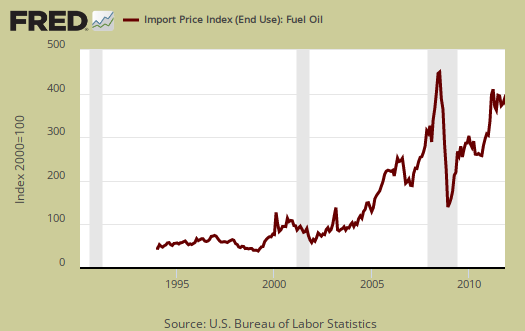
The United States basically has two major ongoing problems with the trade deficit, Chinese goods and Oil imports. Below is the not seasonally adjusted import price index for oil fuel. In October the average price for a barrel of oil was $98.84, down from September's price of $101.02. This explains the drop in petroleum related imports and thus the decline in this month's trade deficit.
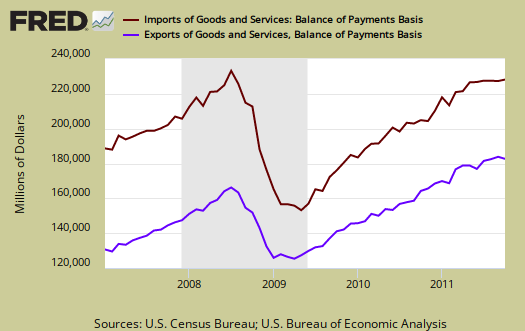
Below are imports vs. exports of goods and services from January 2007 to October 2011. Notice how much larger imports are than exports, but also notice the growth, or rate of change between months of U.S. exports over time. To state the obvious, imports subtract from GDP and exports add.
Below is the list of good export increases from September to October, seasonally adjusted. While last month we saw non-monetary gold exports increase $1.553 billion, October brings a similar decrease, -$1,181 billion in non-monetary gold.
- Automotive vehicles, parts, and engines: -$0.57 billion
- Industrial supplies and materials: -$1.340 billion
- Other goods: +$0.247 billion
- Foods, feeds, and beverages: -$0.80 billion
- Capital goods: +$0.450 billion
- Consumer goods: -$0.552 billion
Exhibit 7 gives Census accounting method breakdown for exports.
Here are the goods import monthly changes, seasonally adjusted. The reason for the drop is once again oil. Crude oil decreased -$1.477 billion and petroleum related imports dropped -$0.354 billion. Remember when the U.S. invented and made computers? In October alone, the United State imported over half a billion, $530 million, worth of computers. That's a lot of jobs....in Asia.
- Industrial supplies and materials: -$3.578 billion
- Capital goods: +$1.134 billion
- Foods, feeds, and beverages: +$0.246 billion
- Automotive vehicles, parts, and engines: -$0.615 billion
- Consumer goods: +$0.725 billion
- Other goods: -$0.91 billion
Running a trade deficit in advanced technology is not a good sign for those jobs of tomorrow. This month had a increase of $2.11 billion in this deficit, or 25.4%. China, again was -$11.425 billion of this deficit, with the entire Pacific Rim deficit being -$12.587 billion. The advanced technology trade deficit usually increases almost every month, meaning we are literally outsourcing America's future. The advanced technology trade data is not seasonally adjusted.
Advanced technology products exports were $25.4 billion in October and imports were $35.9 billion, resulting in a deficit of $10.4 billion. October exports were $1.2 billion more than the $24.2 billion in September, while October imports were $3.3 billion more than the $32.5 billion in September.
Ya gotta love the report. Corporations, yes those things, are forcing our government statistical agencies to sign NDAs and confidentiality agreements to even get any aggregate data. Thus, we don't get a clear break down on advanced technology products or jobs offshore outsourced. You can get the reason for the advanced technology trade deficit, I.T., computers, networking gear. But did you know there is a -$2.434 billion deficit in Opto-Electronics and even biotechnology? The jobs of tomorrow that were supposed to replace the previous offshore outsourced jobs of tomorrow, nano and biotech...we're running a trade deficit.
Here is the breakdown with major trading partners, not seasonally adjusted. China is the worst trade deficit, with $28.1 billion. We are clearly China's export dumping ground.
OPEC can be assumed to be oil and it decreased for October dramatically, but is not seasonally adjusted. The OPEC nations are: Algeria, Angola, Ecuador, Iran, Iraq, Kuwait, Libya, Nigeria, Qatar, Saudi Arabia, United Arab Emirates, Venezuela. OPEC accounts for about 48.6% (customs basis), of all crude oil imports by nation and is 13.7% of the total goods trade deficit this month, and a drop of -20.13% from last month's trade deficit with OPEC. Still we see every month, our problem is clearly China and oil imports. The amounts in parenthesis are August's deficit figures. Notice how the trade surplus list is super short.
The September figures show surpluses, in billions of dollars, with Hong Kong $3.0 ($4.3 for September), Australia $2.1 ($1.4), Singapore $1.0 ($1.3), and Egypt $0.2 ($0.1).
Deficits were recorded, in billions of dollars, with China $28.1 ($28.1) OPEC $8.3 ($10.4), European Union $8.0 ($6.4), Japan $6.2 ($5.2), Mexico $5.3 ($5.0), Germany $4.3 ($4.3), Ireland $2.8 ($2.3), Venezuela $2.3 ($2.0), Canada $2.2 ($3.5), Nigeria $1.9 ($1.9), Taiwan $1.7 ($1.5), and Korea $1.4 ($1.5).
In 2008, we broke monthly total trade deficit figures of $60 billion. This includes goods and services.
Here is Septembers's report overview (unrevised, although graphs are updated). Here is the BEA website for additional U.S. trade data.
You might ask what are these Census Basis versus Balance of Payment mentioned all over the place? The above mentions various accounting methods so we're comparing Apples to Apples and not mixing the fruit. The trade report in particular is difficult due to the mixing of these two accounting methods and additionally some data is seasonally adjusted and others are not. One cannot compare values from different accounting methods and have that comparison be valid.
In a nutshell, the Balance of Payments accounting method is where they make a bunch of adjustments to not count imports and exports twice, the military moving stuff around or miss some additions such as freight charges. The Census basis is more plain raw data the U.S. customs people hand over which is just the stuff crosses the border. The 2005 chain weighted stuff means it was overall modified for a price increase/decrease adjustment in order to remove inflation and deflation time variance stuff.
Bottom line, you want just the raw data of what's coming into the country and going out, it's the Census basis and additionally the details are only reported in that accounting format. Additionally the per country data is not seasonally adjusted so watch out trying to add those numbers into the overall trade deficit. It's a statistical no-no to mix seasonal and non-seasonally adjusted numbers.
The Census is also getting into the graphing game with some nice pie charts breaking down exports by country, as well as a chart showing petroleum as an overall percentage of the trade deficit.
Recent comments