
Q3 GDP 2011 was revised down a full half percent to 2.0%. from 2.5%. Here is the original BEA GDP report. The downward revision was due to inventories, offset by a surprise reduction in imports.

Q3 GDP had a sharp increase in personal consumption a cliff dive in private inventories, a bump up in fixed investment that wasn't housing and reduction in the trade deficit. The government is fairly D.O.A. in adding to economic growth now.
As a reminder, GDP is made up of: where Y=GDP, C=Consumption, I=Investment, G=Government Spending, (X-M)=Net Exports, X=Exports, M=Imports*.
Here is the Q3 2011, second revision, breakdown of GDP by percentage point contributions. Without final rounding, Q3 GDP was 2.00%.
- C = +1.63
- I = –0.10
- G = –0.02
- X = +0.59
- M = –0.09
Here is the Q3 2011 advance report breakdown of GDP by percentage point contributions. The BEA rounds to one decimal place on final percentages, Q3 GDP was actually 2.45%
- C = +1.72
- I = +0.52
- G = 0.00
- X = +0.55
- M = –0.34
Below are the percentage point differences, or spread between the Q3 2nd revision and Q3 advance GDP report components, by percent point contribution. The quarterly change in private inventories was revised down significantly, from a -1.08 to –1.55 percentage points, as we warned about in the monthly inventory report overview. The change in private inventories revision alone shaved off -0.43 percentage points from the original 2.5% Q3 GDP reported.
- C = -0.09
- I = -0.62
- G = -0.02
- X = +0.04
- M = +0.25
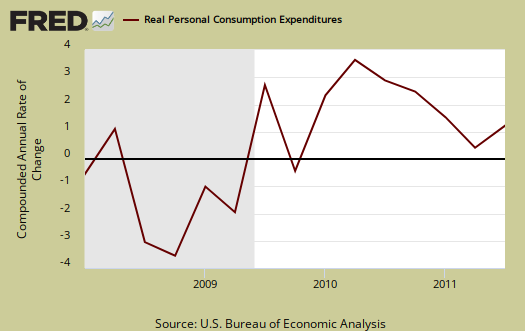
Below the the St. Louis FRED graph for C of the above GDP equation, or real personal consumption expenditures, percentage change . As we can see from the above, PCE, or C in the above percentage point contribution, is the reason for stronger GDP growth in Q3.
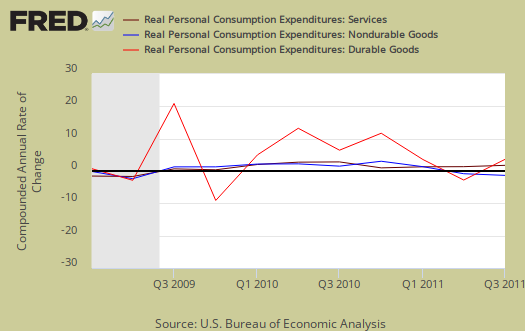
Below is the breakdown in C or real PCE annualized percentage quarterly change. The third quarter PCE percentage point breakdown was a -0.05 downward revision to +1.33 percentage point contribution in services, goods was also revised down by -0.05 percentage points, to +0.30 with durable goods being revized up by +0.10 percentage points from the advanced report, to +0.41 of the +2.0 GDP. Notice when times are tough, durable goods (bright red) consumption drops. Where people spent their money in Q3 was personal household expenditures, a +1.32 percentage point contribution to GDP. Health care expenditures was +0.61 percentage points of Q3 GDP. PCE is often revised from the advance report as receipts and reports are collected. Below is PCE with the breakdown of goods versus services.
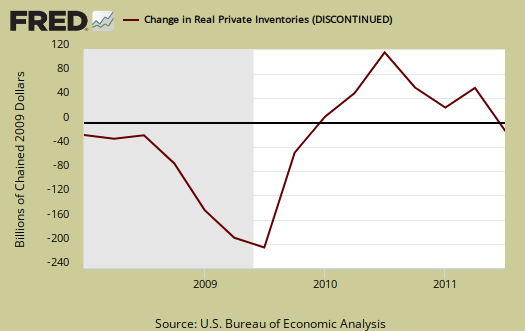
Changes in private inventories subtracted –1.55 percentage points from Q3 2011 GDP. Last quarter changes in private inventories contributed a –0.28 percentage point change. The change in private inventories point contribution reduced Q3 GDP by 56.3%. Companies reduce inventories when they believe an economic slowdown will happen.
Below are real final sales of domestic product, or GDP - inventories change. This gives a better feel for real demand in the economy. This is the better news of this GDP release, it shows real demand increased 3.6% (3.55% not rounded), versus 1.6% for Q2.

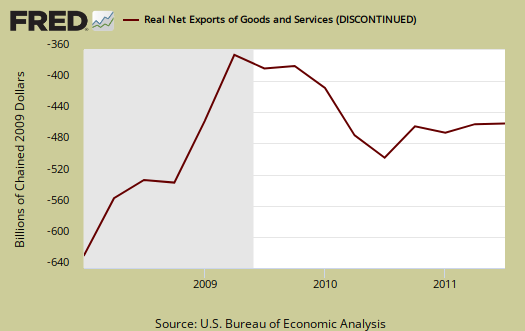
Below are net exports, or the trade deficit, in real chained dollars, for Q3 2011. The Q3 revision gave a +0.29 percentage point contribution boost to Q3 GDP, mainly to the decrease in imports.
The below graph shows real imports vs. exports. Exports increased, 4.3%, revised up from 4.0% from last quarter, in comparison to 3.6% for Q2. Q3 imports increased 0.5%, revised significantly down from the 1.9% change reported in the advance report. Q2 was a 1.4% increase in imports.. It is the trade deficit that matters for GDP, although volume of trade implies a slower global economy. These numbers are almost always revised from the advance report as Census trade data comes in from customs.

Below are the percentage changes of Q3 2011 GDP components in comparison to Q2, along with the advanced report quarterly percent changes. Realize there is a difference between percentage change and percentage point change. Point change adds up to the total GDP percentage change and is reported above. The below is the individual quarterly percentage change, against themselves, of each component which makes up overall GDP.
- C = +2.3%, revised down +2.41%
- I = –0.9%, revised down from +4.1%
- G = –0.01%, revised down from 0.0%
- X = +4.3%, revised up from +4.0%
- M = +0.5 revised down from +1.9%
The BEA's comparisons in percentage change breakdown of 2nd quarter GDP components are below. Changes to private inventories is a component of I.
C: Real personal consumption expenditures increased 2.3 percent in the third quarter, compared with an increase of 0.7 percent in the second. Durable goods increased 5.5 percent, in contrast to a decrease of 5.3 percent. Nondurable goods decreased 0.6 percent, in contrast to an increase of 0.2 percent. Services increased 2.9 percent, compared with an increase of 1.9 percent.
I: Real nonresidential fixed investment increased 14.8 percent in the third quarter, compared with an increase of 10.3 percent in the second. Nonresidential structures increased 12.6 percent, compared with an increase of 22.6 percent. Equipment and software increased 15.6 percent, compared with an increase of 6.2 percent. Real residential fixed investment increased 1.6 percent, compared with an increase of 4.2 percent.
The change in real private inventories subtracted 1.55 percentage points from the third-quarter change in real GDP after subtracting 0.28 percentage point from the second-quarter change. Private businesses decreased inventories $8.5 billion in the third quarter, following increases of $39.1 billion in the second quarter and $49.1 billion in the first.
X & M: Real exports of goods and services increased 4.3 percent in the third quarter, compared with an increase of 3.6 percent in the second. Real imports of goods and services increased 0.5 percent, compared with an increase of 1.4 percent.
G: Real federal government consumption expenditures and gross investment increased 1.9 percent in the third quarter, the same increase as in the second. National defense increased 4.7 percent, compared with an increase of 7.0 percent. Nondefense decreased 3.8 percent, compared with a decrease of 7.6 percent. Real state and local government consumption expenditures and gross investment decreased 1.4 percent, compared with a decrease of 2.8 percent.
Motor Vehicles was revised up, added +0.18 percentage points, from the original +0.07 percentage points reported, to Q3 real GDP while computer final sales added +0.22 percentage point changes. This is different from personal consumption, or C auto & parts. Motor vehicles, computers are bought as investment, as fleets, in bulk, by the government and so forth.
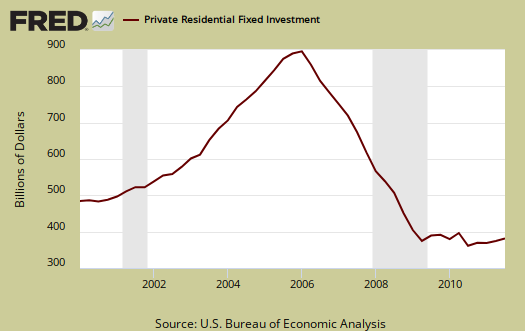
Residential fixed investment added +0.04 percentage points to Q3 GDP, revised down -0.01, after subtracting a paltry +0.09 percentage points in Q2. In other words, residential fixed investment is D.O.A.. Below is the raw totals on residential investment. If one could ever see the housing bubble and then it's collapse in terms of economic contributions, the below graph is it.
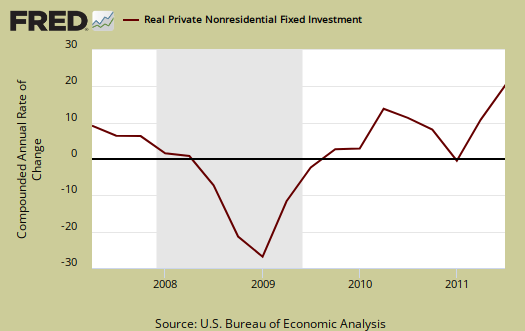
Private, or not from the government, nonresidential fixed investment was revised down, from a 1.54 percentage point contribution to Q3 GDP to 1.45. Equipment and Software was the major revision, 1.08 percent point contribution, instead of the 1.20 originally reported. Equipment & software represents a 15.6% percentage change from Q2 to Q3.
Since the GDP report is in real chained 2005 dollars, one might notice the price index used for Q3 is much less than Q2. In other words, less inflation, more real value in comparison to the previous quarter. In spite of the price index being revised down, we still see a -0.5 percent point GDP downgrade
The price index for gross domestic purchases, which measures prices paid by U.S. residents, increased 1.9 percent in the third quarter, 0.1 percentage point less than in the advance estimate; this index increased 3.3 percent in the second quarter. Excluding food and energy prices, the price index for gross domestic purchases increased 1.8 percent in the third quarter, compared with an increase of 2.7 percent in the second.
In current dollars, not adjusted for prices, GDP, or the U.S. output, is $15.1809 trillion, an increase of 4.6%, or $168.1 billion from Q2, revised down from 5% change between quarters. Applying the price indexes, or chained, real 2005 dollars, Q3 GDP was $13.3378 trillion.
Here are the overview for the Q3 2011 GDP, advance report, unrevised.
Q2 2011 GDP remained the same at 1.3%.
* In Table 2, the BEA reports GDP contribution components with their equation sign. If durable goods for example, decreased over the quarter or year, it is reported as a negative number. Imports, from the GDP equation, are already a negative for that is not something produced domestically. A negative sign implies imports increased for the time period and a + sign means the change in imports decreased. Or, from the GDP equation: . Confusing but bottom line exports add to economic growth, imports subtract.
Recent comments