
The BEA released corporate profits for Q3 2011 along with the Q3 2011 GDP, 2nd revision. Corporate profits increased $39.8 billion to $1.9774 trillion. While GDP is anemic, and we're desperate for 12 million jobs right now, corporate profits are at all time nominal highs.
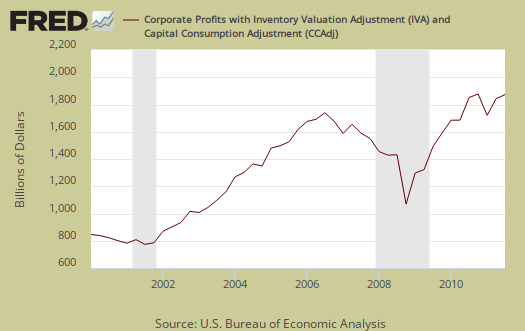
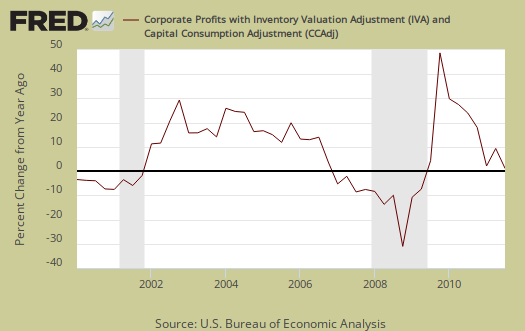
Pre-tax Corporate profits increased 2.1% from Q2 to Q3 and increased 7.9% from one year ago. Q2 pretax corporate profits were revised, from 3.0% to 3.3% change from Q1 to Q2.
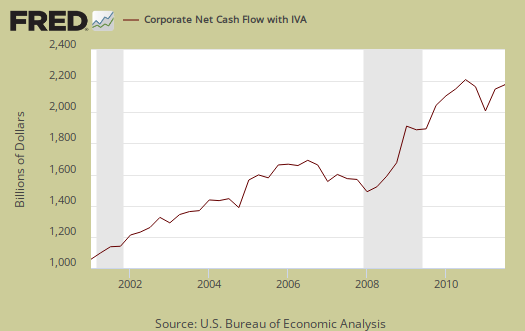
What is astounding is the massive amount of cash corporations have for investment. Net cash flow increased 2.2% from Q2 and has increased 9.6% from a year ago. Corporations now have over $1.852 trillion dollars available for domestic investments and hiring people, which everyone in America is aware they are not doing, astounding.
The breakdown of financial versus nonfinancial shows both sectors were profitable for Q3.
Domestic profits of financial corporations increased $16.0 billion in the third quarter, in contrast to a decrease of $54.2 billion in the second. Domestic profits of nonfinancial corporations increased $17.4 billion in the third quarter, compared with an increase of $80.8 billion in the second.
Gross value added is production, or output of a company minus the inputs, or consumption it uses to make that output. The decline in gross value added, adjusted for inflation, isn't great news. It implies less output, or corporate products and services.
In the third quarter, real gross value added of nonfinancial corporations decreased, and profits per unit of real value added increased. The increase in unit profits reflected an increase in unit prices that was partly offset by increases in both unit labor and nonlabor costs.
Quarterly tax receipts also declined for Q3, -$5.6 billion in comparison to -$1.8 billion in Q2. That said, to truly get a feel for how much corporations are really paying, or not, one needs to look at annual returns.
Profits after tax with inventory valuation and capital consumption adjustments, increased $45.5 billion for Q3 2011, or a 3.0% increase from Q2 and are up 11.4% from last year. The BEA reports corporate profits in a variety of ways and it seems whatever one's focus and political predilections are implies which number they use.
Regardless, these numbers are simply incredible considering the jobs crisis and how most of America is getting less and less of the economic pie.
From the BEA's magic secret decoder ring guide to National Income and Product Accounts (large pdf), national income also uses inventory valuation and capital consumption adjustments. Their reasoning for inventory valuation is this:
Inventory valuation adjustment (IVA) is the difference between the cost of inventory withdrawals valued at acquisition cost and the cost of inventory withdrawals valued at replacement cost. The IVA is needed because inventories as reported by business are often charged to cost of sales (that is, withdrawn) at their acquisition (historical) cost rather than at their replacement cost (the concept underlying the NIPAs). As prices change, businesses that value inventory withdrawals at acquisition cost may realize profits or losses. Inventory profits, a capital-gains-like element in business income (corporate profits and nonfarm proprietors’ income), result from an increase in inventory prices, and inventory losses, a capital-loss-like element, result from a decrease in inventory prices.
The mysterious capital consumption adjustment, along with inventory valuations, derives current production income.
The private capital consumption adjustment (CCAdj) converts depreciation that is on a historical-cost (book value) basis—the capital consumption allowance (CCA)—to depreciation that is on a current-cost basis—consumption of fixed capital (CFC)—and is derived as the difference between private CCA and private CFC.
Since this is what the BEA uses for national accounts and makes much more sense from a business accounting perspective generally, seems the above before and after tax numbers are the right metrics to use when thinking about corporate profits from a national and macro-economic perspective.
If the above magic secret BEA decoder ring didn't make much sense, try this one:
Corporate profits with inventory valuation and capital consumption adjustmentsis the net current-production income of organizations treated as corporations in the NIPA's. These organizations consist of all entities required to file Federal corporate tax returns, including mutual financial institutions and cooperatives subject to Federal income tax; private noninsured pension funds; nonprofit institutions that primarily serve business; Federal Reserve banks; and federally sponsored credit agencies. With several differences, this income is measured as receipts less expenses as defined in Federal tax law. Among these differences: Receipts exclude capital gains and dividends received, expenses exclude depletion and capital losses and losses resulting from bad debts, inventory withdrawals are valued at replacement cost, and depreciation is on a consistent accounting basis and is valued at replacement cost using depreciation profiles based on empirical evidence on used-asset prices that generally suggest a geometric pattern of price declines. Because national income is defined as the income of U.S. residents, its profits component includes income earned abroad by U.S. corporations and excludes income earned in the United States by the rest of the world.
Bottom line Q3 shows the same thing we've seen for some time, corporations are not hiring (in the United States), and sitting on cash instead of using it to hire and expand (uh, domestically).
Q2 corporate profits overview, unrevised, is here.
Nothing to fear but fear itself?
"What is astounding is the massive amount of cash corporations have for investment. Net cash flow increased 2.2% from Q2 and has increased 9.6% from a year ago. Corporations now have over $1.852 trillion dollars available for domestic investments and hiring people, which everyone in America is aware they are not doing, astounding." -- Robert Oak
I can't find links for this right now, but I am sure that there has been a not uncommon analysis of recent Berkshire Hathaway equity purchases as all about seeking very large companies well-situated to withstand shocks to the global economy. Holding cash is a defensive strategy, albeit very different from the defensive strategy that focuses on PM in anticipation of the collapse of major global currencies and related financial components of the global economy.
In general, there's an atmosphere of fear and pessimism driving global capital these days. Thus, the mega-corporations are choosing to hold cash -- even though interest on demand deposits, US Treasurys or other forms of cash is low and even though all these forms of cash, in and of themselves, may carry some degree of risk.
One reason for the corporate deep-pockets defensive strategy is that management finds that they can hold cash, as opposed to a few years ago when holding cash meant that you were courting a hostile leveraged takeover. On the other hand, another reason for the defensive strategy may be that management finds that they must hold cash in order to survive over the next few years.
IMO, it all has to do with the relation between productive components of the global economy and financial components. The financial part of it is a huge and dysfunctional Gordian Knot that probably cannot be disentangled except by cutting though it. But will this mean that productive components of the global economy are destined to evaporate during what seems to be developing into a Second Great Depression? How an investor decides that key question likely depends to a great extent on how the investor sees the Peak Oil crunch (or Armageddon).
Here's from one of the long-term bulls who are looking to make lemonade from the lemons of a bear market:
(Calhoun, who trained as an engineer and spent 8 years in the US Navy Submarine service, has worked in the financial services industry for 17 years as a broker and investment advisor.)