
Everybody is touting the December jobs report as some sort a miracle. It's not. People, we're down over 10 million jobs.
Economist Dean Baker railed at the press over the lack of data reality checks.
Does the Obama Administration Really Want People to Celebrate Job Growth That Will Get Us Back to Full Employment in 2028?
What does Baker mean by that? Baker likes to use yearly averages. For 2011, the United States added 1.64 million jobs.
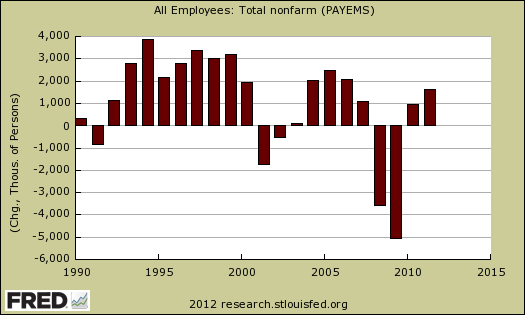
As we showed in the December jobs report overview, we are currently down 10.06 million jobs, officially. At this annual job growth rate of 1.64 million jobs, it will take over 6 years just to recover those 10 million jobs, or 2018.
Where does Baker get the year 2028 from? Baker assumes about 1 million people per year are added to the labor force who need jobs. This gives a 600,000 real job growth, taking into account the jobs needed just to keep up with population growth. It will take 16.67 years to get those 10 million lost jobs back at this pace. In other words, the year 2028 is when we would get to where we were in 2007 for jobs.
Not to be outdone, Economist Paul Krugman also whipped out his calculator. In the soft bigotry of low expectations Krugman notes we're in for a decade long haul to get back to full employment.
There are still about 6 million fewer jobs than there were at the end of 2007 — and that we would normally have expected to have added around 5 million jobs over a four-year period. So we’re 11 million jobs down — and we need at least 100,000 jobs a month just to keep up with working-age population growth. Do the math, and you’ll see that it would take 9 or 10 years of growth at this rate to restore full employment.
With Krugman's assumptions, we have a civilian labor force that grows by 1,2 million per year. Krugman took the monthly job growth of 200,000 and extrapolated that to an annual growth of 2.4 million jobs. Subtract off your 1.2 million new workers per year eating up half of those jobs and we get 1.2 million in actual annual job creation. Krugman also assumes we're down 11 million jobs. Dividing 11 million jobs needed by 1.2 million created per year, we get over 9 years to get back to where the U.S. was in 2007.
Sad isn't it? What's reality on increased population, increased labor force and jobs? First thing to note is next month the BLS will incorporate the 2010 Census data in their statistics. We've already predicted all hell will break loose when it comes to the unemployment rate, the civilian labor force, the participation rate and all of those lovely ratios which are dependent upon accurate statistics of the U.S. population.
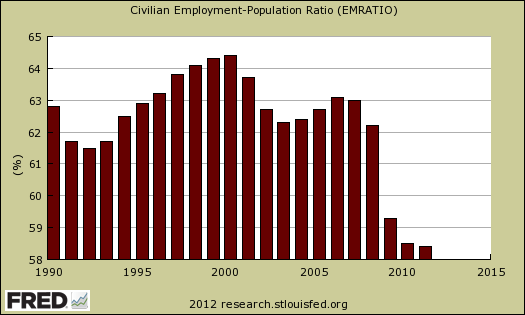
For now, the first thing to look at is the labor participation rate. It's at all time lows as we noted earlier. That means there are a hell of a lot of people not being counted as part of the labor force who probably are gonna want a job.
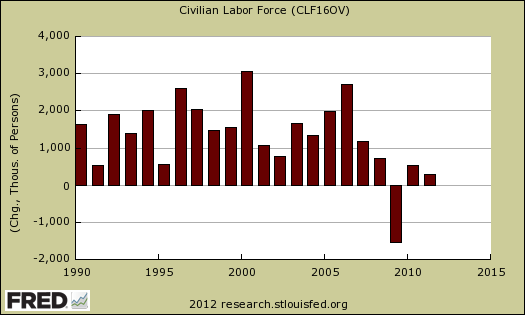
The below graph shows the decline in the civilian labor force. This the subgroup of people counted as employed or unemployed. The below is the yearly change in the total. Look at how the labor force shrunk in 2009.
Now, here is the graph of the non-institutional population. This is everybody 16 years or older who isn't in the military, prison, nursing homes, hospitals and does include the able bodied retired.
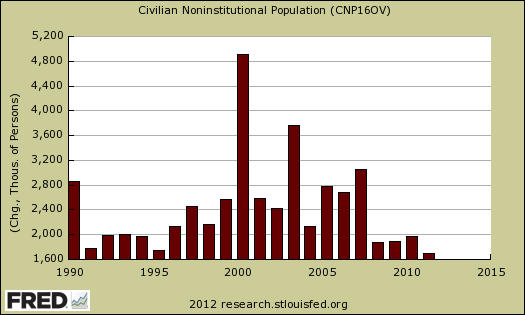
See those huge spikes in the yearly change from 2000, 1990? Those are the new Census numbers being adjusted into the tally. Makes a huge difference when the latest Census is taken. It's almost a start over from here reference point.
Now, look at how much of the non-institutional population considered not in the labor force grew each year.
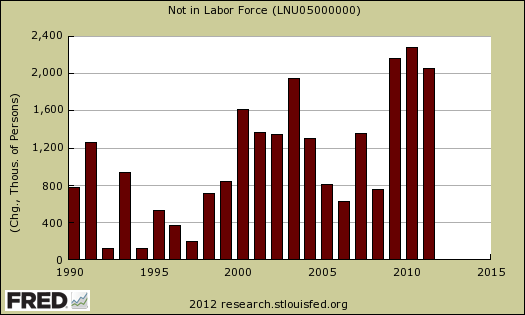
That's abby normal to see such large spikes of those not in the labor force. Now various folks in denial will try to claim that's due to people going to school or retired. Let's look at those numbers.
First, enrollment in higher education has increased. In 2009 total enrollment was 20 million. 50% of all 18 and 19 year olds were enrolled. 27% of students are over the age of 25 and 16% of students enrolled are over the age of 35 yet make up 37% of the part-timers. That said, graduating is another story, these percentages are pathetic and atrophied.
While the increase in adult students sounds like a lot, consider population growth. The non-institutional population of 18-24 year olds is 38.12 million with 41% or 15.6 million being enrolled in some form of higher education.
Let's subtract off those 15.6 million 18-24 year olds enrolled in some sort of higher education, even part time and look at labor participation rates. Labor participation rates are the employed plus the unemployed divided by the civilian non-institutional population.
Ok, for the 18-24 year old group, lets subtract off 15.6 million in some sort of higher education We then get a non-institutional civilian population, not in school, number of 22.5 million. Total employed is 16.255 million. Total unemployed is 3.047 million. This gives a labor participation rate for 18-24 year olds of 85.8% instead of the 50.6% rate it would normally be for 18-24 year olds. The labor participation rate for everybody was 64% in December 2011.
To give another realty check, the labor participation rate for 18-24 year olds was 69.3% in November 2007. That's a long ways down to the current 50.6% labor participation rate using the same calculation methods.
That said, the employment rates do not count people in college full-time not looking for a job. They count those wanting and actively looking for a job. The employment rate is calculated by the ratio of unemployed to the civilian labor force The unemployment rate for those between the ages of 16-19 is 23.1% and for 20-24 year olds the unemployment rate is 14.4%. The November 2007 unemployment rate for 20-24 year olds was 8.3% and for 18-19 years of age unemployment rate was 14.3%.
Of the people enrolled in some sort of higher education, 37.7% of them are part-time. Part-time implies they are working or looking for work. Even if we take a raw 25% of those between the ages of 18-24 are working or looking for part-time jobs, we get a labor participation rate for ages 18-24 total, including college students who are trying to work part-time, of 73.1%.
What this says is there are a hell of a lot of young people who need a job. Anyone claiming 18-24 year olds all magically went to school and somehow labor participation rates override their unemployment rate is smokin' a pipe dream. Like we said, people who are in college, not looking for a job are not counted in the unemployment rates.
That still doesn't get to how many jobs really are needed each month to get to full unemployment now does it? Well, it's all ratios.
As we noted, when the Census 2010 data is incorporated, starting next month, this is all gonna change. For now I enjoy this exercise to figure out how many jobs are needed each month to keep up with population.
First, we already know to get back our 10 million jobs at a rate of 200k jobs per month is 2.4 million a year or at little over 4 years. If we take our annual non-institutional civilian population growth and take it times our annual non-institutional civilian population to employment ratio of 2007, or 63%, we get a low of 1.23 million jobs needed for 2011 and a high of 1.92 million jobs needed in 2007 to keep up with population growth. Currently the ratio of non-institutional civilian population to employment is 58.5%, a dramatic decline.
That's right, non-institutional population growth has changed over the years and this is where all other things are derived. These ratios will also change dramatically as the new Census 2010 base value is incorporated into the BLS statistics.
Taking the last 5 year average annual change of employed to non-institutional civilian population, we get 1.36 million jobs needed each year to keep up with population growth. At a rate of 200,000 jobs gained each month, that's 6.8 months of the year just keeping up with population growth or 113.4 thousand jobs each month needed. That gives us 86,569 jobs per month extra to make up for the 10 million jobs lost, or a whopping 9.68 years to get back to 2007 unemployment levels.
Q.E.D. Krugman was right and so is Baker, depending on how many jobs are needed really to keep up with population growth.
Bottom line, 200k jobs per month is no miracle. It just goes to show ya how politicians count on you not being able to add and subtract.
Comments
kids in school
To really tackle the claim that uber-low labor participation rates are all because 18-24 year olds are in higher education, I need accurate, raw data going back for 20 years of ages and enrollment figures and a breakdown in all ages, not just 18-24. Why? Because while it's obvious the majority of students are between 18-24, to be accurate, one must adjust labor participation rates for all ages. So, in other words, I need to remove the 35 year olds from the equation who are in school, the retired from the older labor participate rates.
Additionally one needs a very accurate number, going back 20 years on who is a student and also working? They are part of the labor force.
The bottom line argument on this labor participation game is to refute the claim that the huge unemployment of 18-24's is just a data anomaly because they all went to school. It's just not accurate and we can see that from the massive drop in the labor participation rate in just 4 years while the overall percentage increases for entering higher education are not proportional.
Another very accurate, detailed statistic I'd like to find is the age break down of everyone locked up. I fear more kids are entering prison these days than college but I don't have accurate raw yearly data yet.