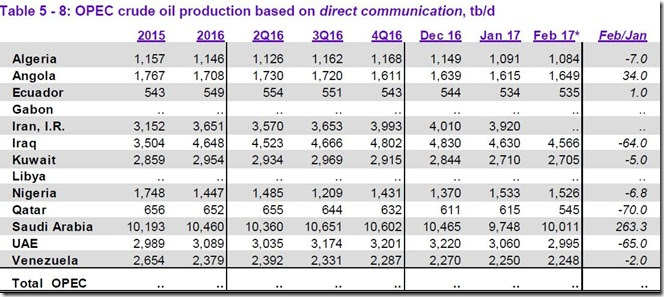
Since oil pricing, and hence the industry's plans for new oil field exploitation in the US, is still largely dependent on what OPEC does, we'll start by looking at the new OPEC Monthly Oil Market Report for March, which covers February OPEC & global data. The first table we'll include here is from page 60 of that OPEC pdf and it shows oil production in thousands of barrels per day for each of the OPEC members over the recent years, quarters and months, just as the column headings are labeled. For all their official production measurements, OPEC uses "secondary sources", such as analyst's reports from satellites and shipping data, as an impartial adjudicator as to whether their output quotas and production cuts are being met, to resolve any potential disputes that could arise if each member reported their own figures. This is also the oil production data we often see quoted in the media, other than that from independent analysis by energy research divisions of organizations such as Platts and Reuters, who will compute & use their own numbers..
Here we can see that this official data shows that OPEC production was down by 139,500 barrels per day to under 32 million in February, from a January oil production total that was revised 42,000 barrels per day lower from what was reported last month (for your reference, here are the official January figures before these revisions). Recall that OPEC committed to reduce their production by 1.2 million barrels per day from their October levels (shown here, with Indonesia), so these figures show the remaining 13 members are now pretty close to achieving what they agreed to. However, there are a number of different estimates out there, and depending on who's judging their output and their promises, their compliance with their pledged oil output cuts could be anywhere from 71.9% to 111.5%. That notwithstanding, it wasn't these official figures from OPEC that attracted the attention to this report last week, but rather the February production figures that the OPEC members reported to the OPEC Secretariat, which are shown in the next table.
The above table, also from page 60 of the OPEC pdf, shows the oil production in thousands of barrels per day that each of the members reported to OPEC (for those that did report). Although this data is considered suspect because of the many incentives OPEC members have to fudge their data, it attracted attention and precipitated a Tuesday selloff because the Saudis reported that they increased their production by 263,000 barrels per day, rather than cutting production by 68,100 barrels per day like the official totals show. While their 10,011,000 barrel per day output was still within their committed range, the increase put to rest the market consensus that the Saudis would cover for the other OPEC members such as the Emirates (UAE), who have not met their promised cuts. While oil prices rebounded after the Saudis explained the extra production was purely for domestic storage, over 10 million bpd was still more production from the Saudis than had been expected, and cast a pall of uncertainty over the market, where traders had believed that OPEC had their production reductions under control..
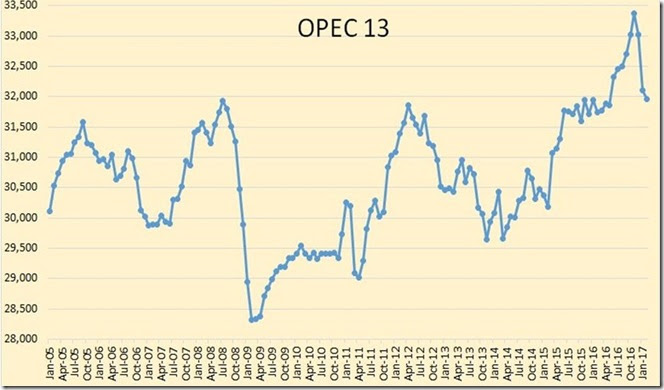
Next, we'll include a graph of the total OPEC oil output for all 13 members included in this report, so we can see how this month's production stacks up compared to historical figures...
The above graph, taken from the 'OPEC February Production" post at the Peak Oil Barrel blog, shows total oil production, in thousands of barrels per day, for the 13 members of OPEC, for the period from January 2005 to February 2017, using the official data from secondary sources. Obviously, we can see that February OPEC production of 31,958,000 barrels per day is down quite a bit from their record production of 33,374,000 million barrels per day in November, achieved during their production run-up before the agreement was reached, but note that their current production is still somewhat more than what they were producing between February and May of 2016, and every other month before that, including last January, when they produced 31,628,000 barrels per day (a figure i arrived at by subtracting Indonesian production from the 14 member total they reported last year.pdf). Similarly, we find that despite all of the brouhaha over the OPEC production cuts, their February 2017 production of 31,958,000 barrels per day is still 1.2% more oil than what the same 13 countries were producing in February 2016.
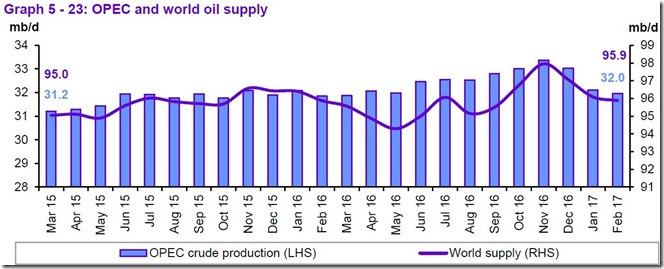
This next graphic we'll include shows us both OPEC and world oil production monthly on the same graph, from March 2015 to February 2017, and it comes from page 61 of the March OPEC Monthly Oil Market Report. The light blue bars represent OPEC oil production in millions of barrels per day as shown on the left scale, while the purple graph represents global oil production in millions of barrels per day, with the metrics for that shown on the right scale. Global oil production fell to 95.88 million barrels per day in February, while it was still unchanged from a year earlier, and OPEC production of 31,958,000 barrels per day thus represented 33.3% of what was produced globally, a decrease from the 33.5% OPEC share in January and 34.0% in December. But even with the two months of production cuts we can obviously see here, there is still a surplus of oil supply globally, as the table we'll include next will show..
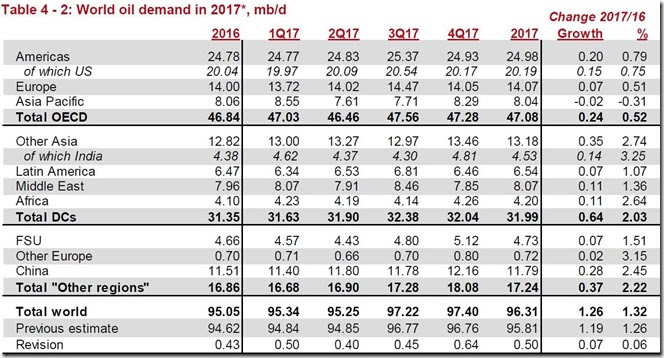
The table below comes from page 37 of the March OPEC Monthly Oil Market Report, and it shows oil demand in millions of barrels per day for 2016 in the first column, and OPEC's forecast for oil demand by region and globally over 2017 over the rest of the table. Note that the forecast for global oil demand in the current first quarter of 2017 is shown on the "Total world" line of the second column, and projections are that during the first three months of this year, all oil consuming areas of the globe will use 95.34 million barrels of oil per day, up from the 95.05 millions of barrels of oil per day they used in 2016. But as OPEC showed us in the supply section of this report and the summary supply graph above, even with their production cuts, the world's oil producers were still producing 95.88 million barrels per day during February. That means that even after all the production cuts have taken place, there continued to be a surplus of more than half a million barrels per day in global oil production...
Note: the above was excerpted from my weekly synopsis at Focus on Fracking


Recent comments