
The Federal Reserve released a report, the 2010 Survey of Consumer Finances. This is a report on household wealth from 2007-2010, removing effects of inflation. No surprise, median net worth declined by 38.8% from 2007 to 2010 and is down to 1992 levels. Why this should be no surprise is due to the housing bubble and declining home values. A home is the largest asset many people have.
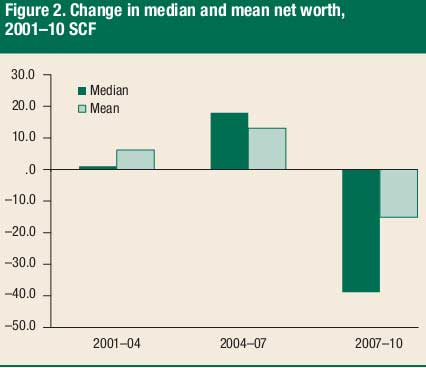
The above report graph shows the median and mean declining net worth. Median is the middle point of all families, ranked from poorest to wealthiest. Fifty percent of all families net worth is above the median, 50% below. That middle point's net worth value declined by 38.8% from 2007 to 2010. Mean is the average net worth for all households and that decline in net worth was much less, 14.7% from 2007 to 2010, levels not seen since 2001.
Net worth includes one's home, stocks, bonds, mutual funds. It is the difference between one's liabilities, or debts and one's assets, such as savings, retirement accounts and a home. It wasn't just home prices and foreclosures that wiped out so much household wealth, stocks didn't do well either, after removing the effects of inflation.
The share of total assets of all families attributable to unrealized capital gains from real estate, businesses, stocks, or mutual funds fell 11.6 percentage points, to 24.5 percent in 2010.
But it was clearly housing which really caused America to go bust. Check out these statistics for people who probably bought their homes closer to the housing bubble, or in the bubble West, their net worth fell by over half!
The decline in median net worth was especially large for families in groups where housing was a larger share of assets, such as families headed by someone 35 to 44 years old (median net worth fell 54.4 percent) and families in the West region (median net worth fell 55.3 percent).
Yet what is more disturbing from this report is income. Median income dropped 7.7% in the three year time period from 2007-2010. That's before taxes and adjusted to removed the effects of inflation. The mean, or average drop in real income was even worse, 11.1%.
The decline in median income was widespread across demographic groups, with only a few groups experiencing stable or rising incomes. Most noticeably, median incomes moved higher for retirees and other nonworking families. The decline in median income was most pronounced among more highly educated families, families headed by persons aged less than 55, and families living in the South and West regions.
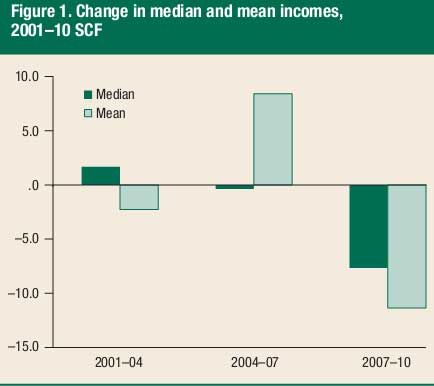
Real mean income fell even more than median income in the recent period, by 11.1 percent across all families. The decline in mean income was even more widespread than the decline in median income, with virtually all demographic groups experiencing a decline between 2007 and 2010; the decline in the mean was most pronounced in the top 10 percent of the income distribution and for higher education or wealth groups.
Below is the table of income and net worth for the survey dates. Notice the massive declines from 2007 to 2010. Quintiles just means dividing up the U.S. by 20% increments. In other words, the bottom quintile are the bottom 20% of U.S. families and 90 means the top 10%.
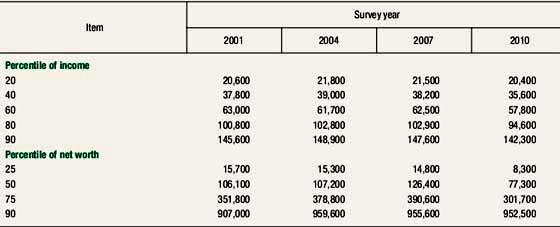
Median means half of households were above that savings, net worth, income level and half were below. The 50 in the above chart for net worth is the median. Mean, or averages are the total wealth, savings, income divided by number of financially independent households.
Income comes not just from wages, but from whatever is coming in, right now, such as profits from investments. What should kill you are the uber-rich basically aren't working, instead their stock portfolios took a hit and why the mean or average declined.
The share of family income attributable to realized capital gains fell from 6.7 percent in 2007 to only 0.9 percent in 2010; income from businesses, farms, and self-employment accounted for only 12.2 percent of income in 2010, down from 13.6 percent in 2007. Offsetting these declines in shares, the share of income from wages and salaries rose 3.6 percentage points; that of Social Security, pension, or other retirement income rose 2.4 percentage points; and that of transfers or other income rose 1.3 percentage points. The share of income from interest or dividends was little changed. The decline in the share of capital gains was largest among the wealthiest 10 percent of families.
The poor, for once, didn't take a hit, on the other hand, subtracting nothing from nothing doesn't come up with a large percentage change. Bottom line, it was the middle class that got hammered.
Across the income distribution between 2007 and 2010, only the lowest quintile did not experience a substantial reduction in median income; the median for that group rose $500.
For other groups, the median decreased between 5.3 percent and 8.9 percent between 2007 and 2010. Similarly, for all income groups except the lowest quintile, the direction of changes in mean income was uniformly negative, with decreases ranging from a 5.8 percent drop for the second-highest decile to a 16.2 percent drop for the top decile.
Just a note, when one sees the mean, or average drop more than the median that usually implies our uber-rich top 1%, top 10% of the population got a wealth or income hit. Considering America's astounding income inequality, if you want to cheer when you see that, go ahead. Decile in the above quote means 10%.
One of the more shocking notes in the Federal Reserve's report are baby boomers. In a matter of 3 years, the population between ages 55-64 increased 11%. By age, retirees, minus the uber-rich, did better than working people.
Every age group less than 55 saw decreases in median income of between 9.1 and 10.5 percent, while families headed by a person between 65 and 74 or 75 or more saw increases at the median.
In this country, you are outright screwed if you are single, especially a woman. The statistics in every report are plain alarming and one must wonder what employers are doing here in terms of opportunities for single parents. The Survey of Consumer Finances classifies single people as families and basically is categorizing America by economic units. In other words, you live alone, you're an economic unit and thus a family. If you have a family and are male, guess what, you're the primary economic unit, even if your wife earns more. Gay, living together? Guess what, if you're older than your partner, you're the economic unit by this survey. (Welcome primary economic units to the Federal Reserve statistical methods and classification system!)
Anyway, single people are screwed as are single mothers. Here is a quote from the report:
By family structure, median incomes declined over the 2007–10 period for all groups, but most notably (negative 14.1 percent) for childless single families (those headed by a person who was neither married nor living with a partner) headed by a person aged less than 55; median income fell the least (2.3 percent) for single families with children. Mean income also fell for most types of families, except childless single families headed by a person aged 55 or older, for whom it rose 3.1 percent. Mean income of childless couples fell the most of all families, when grouped by family structure (15.6 percent).
Working self-employed were also kicked to the curb on income in 2007-2010. Their income dropped by a whopping 18.7%.
Median income fell 5.7 percent from 2007 to 2010 for families headed by a person who was working for someone else, but it fell much more (18.7 percent) for those who were self-employed; the median rose 12.4 percent for the retired group and 12.2 percent for the other-not-working group.
The mean over this period fell for all groups, especially for the self-employed group (a decrease of 25.4 percent) and the retired group (a decrease of 17.0 percent).
The breakdown in net worth is an astounding display of income inequality. Check out the differences between the bottom 20% and the top:
The overall median net worth for the lowest income quintile in 2009 was $10,000. Among families in the lowest quintile group in 2009, those who were also in the group in 2007 had median net worth in 2009 of $4,500, those who were in the second quintile group in 2007 had median net worth in 2009 of $19,200, those who were in the third quintile group in 2007 had median net worth in 2009 of $32,000, and those in the two higher quin-tile groups in 2007 had progressively higher median net worth in 2009—up to $740,500 for the top quintile group.
The below section breaks up American families by net worth and then gives percentage changes on their income. Once again, the middle class is plain hammered.
By percentile of net worth, median income fell for every group, with the smallest decline occurring for the top 10 percent of wealth holders, for whom income fell 1.4 percent. The decline in median income was also relatively small for the lowest quartile, for which the median fell 3.7 percent; the median declined most for the middle income groups (12.1 per-cent for the second quartile, 7.7 percent for the third quartile, and 13.6 percent for the group between the 75th and 90th percentiles).
On straight net worth, check this out, the poor lost 100% of their net worth.
From 2007 to 2010, the median for the lowest quartile of net worth fell from $1,300 to zero—a 100 percent decline; at the same time, the mean for the group fell from negative $2,300 to negative $12,800. For the second and third quartiles, the median and mean declines in net worth were smaller but still sizable; for example, median net worth for the second quartile fell 43.3 percent. Median and mean net worth did not fall quite as much for the higher net worth groups. For the 75th-to-90th percentile group, the median fell 19.7 percent while the mean fell 14.4 percent. For the wealthiest decile, the 11.0 percent decline in the mean exceeded the 6.4 percent decline in the median for that group
America is not saving either. According to the report, we have the lowest level of saving on record.
From 2007 to 2010, the proportion of families that reported that they had saved in the preceding year fell substantially, from 56.4 percent to 52.0 percent. That decreasepushed the fraction of families reporting saving to the lowest level since the SCF began collecting such information in 1992.
There is much more to this report and we hope we've clarified some of the definitions used. Bottom line, the great recession looks to have further wiped out the U.S. middle class, what a surprise.
Comments
Less income, less wealth = people desperate to work like slaves
This was so obviously planned. This is what happens when you plan a race to the bottom by corporate boardrooms that take lessons from the Gilded Age (yeah, 100 years ago, and something great Americans like Mark Twain railed against 100 years ago - too bad corporate education and MSM didn't stop me from reading such luminaries before they grabbed control of everything). But unlike the Gilded Age, corporate CEOs nowadays demand workers work for free in BS "internships."
People without jobs get poorer. No income, they tap into savings to stay alive. People who are unemployed are deemed "unemployable" by corporations, the govt., and the media. The unemployed are told to pay for all their own training which makes no difference as far as getting a job, but makes them even POORER! So now people become more desperate. Corporate-owned media says, "The new normal is contractors that companies can cut loose after a few months with no benefits during the contract and no unemployment or benies." But that's applauded by the media. Also, internships that literally pay NOTHING are now rampant in private firms and the US GOVT. for people with advanced degrees (US Attorneys' Offices across the USA now "hire" attorneys for free for one year stints), so don't plan on the USG caring about slave wages or no wages.
So, no jobs for most Americans, jobs that do pay pay complete crap, Americans are told to work for free, and income drops?! SHOCKING! Is this how American communities were built in the past? Can Americans marry, and have kids, and buy a crap car, and maybe rent a two-bedroom apt. or maybe plan on staying in a town for more than 5 years when they are earning $8/hr. with a BS and PhD in engineering and $100,000 in loans? Is this the American Dream?
How I long for Pakistani work conditions, if only I wasn't too old by 20+ years to make soccer balls and Nike shoes. Maybe one day Fox and CNN and Forbes and Gingrich and the corporate-owned govt. can tell me it's good when an American child makes soccer balls instead of school, after all, that book learning may have been a vision of our Founding Fathers' but who needs it now when the corporate piggies tell us what's best and the govt. goes along with everything their masters want.
-Kurtz
Your are so right
U.S. Corporations have decided that they need to be International Corporations so they can convince the public that it's OK to offshore our jobs so they can please the almighty investors but, it is backfiring on them. IBM just lost the Disney Contract because of the low level of support received from the people in India. Many other companies will be doing the same thing when they realize they get what they pay for. Those companies that fired American workers and replaced them with those of India and China will be losing a lot of customers and those experienced I.T. Professional in the U.S. will not go back to work for the likes of IBM, HP or any other company that offshores. American's are the innovators and we will do just fine starting our own companies and taking their business away from them.
I hope they bring the jobs back
Yes, they turned their back on us. Yes, I wouldn't go back working for them, IF I had another choice. Not everyone has the luxury of choosing their employer. At this point I'm really hoping corporations like them will re-hire us. I just read this report and it doesn't look like many of us will keep their pride and refuse a job offer. If the employment situation doesn't improve soon I'm more likely to accept the service agreement I got from http://debtsettlement.com/ than to say no to a job.
They won't change unless they are given proper motivation
The companies and CEOs and politicians are getting extremely wealthy with the status quo - they have absolutely no incentive to bring any jobs back, improve the job situation here, or care about the destruction of the middle class. They are fine with temporary $8/hr. jobs and free internship here, bringing in visa workers, and outsourcing everything else. Hoping that someone is lucky enough to catch a crumb from their table will only lead to a quicker destruction of society and force people to get meaner and more aggressive to catch one of those plumb rare jobs that pays minimum wage. CEOs and politicians don't change based on hope, they only change when they see right in front of their faces they have no better option.
Great charts! Over at
Great charts!
Over at Reuters' Felix Salmon Blog on this topic, a commenter "Robert" wrote
"I don’t like seeing median – it’s too susceptible to outliers. I’d like to see the middle 80% of historical data."
I wanted to route him to this site but being computer challenged I can't figure out how to get a comment in.
Perhaps someone might help Robert.
Tom
these aren't my charts, they are the report charts
I reprinted the ones I found useful. Well, well, now I am glad I amplified what median and mean means.
It's not the median that has outliers it's the mean or average that can skew the result.
Unless of course one wants to dismiss half of America is basically poor. Additionally the report breaks down a host of data by 5ths and 10ths, in other words by demographic brackets. There too are declines. I pulled a series of quotes showing some which really stuck out on income and a few on net worth.
So removing the top 20% and the bottom 20% still doesn't eradicate the decimation of the middle class, that's really the most damning and what this Fed report shows.
Sure try giving a link to this post on Felix Simon's blog, we'd appreciate it.
We link to the actual government report almost always in the 1st paragraph. This report is dense, since it's using quite a mix of population demographics to show their various economic states by 2010. The report is difficult to read, dense, which is another reason we amplify some of the more incredible statistical results and use words such as screwed to explain.
Anyway, we see a lot in the press getting it wrong or not explaining enough details to say why this report should raise alarm bells for the U.S. middle class and U.S. worker.
We do make a lot of original charts here, but I didn't see the data released with the report, separate, in database form, except for extrapolating out table data from a pdf, which is a big pain, so we used the report table and charts.
Political contributions vs. # of crimes 1% are allowed to commit
1) Median campaign contribution by industry (and top companies) vs. profits and taxes actually paid to USG
2) Political contributions by industry vs. # of legislative bills created for that industry (I'd start with Silicon Valley and H-1B visas, Bill "FoxNews just quoted me as saying I cannot find any qualified Americans with 22% unemployment so we need more foreigners to take jobs" Gates, and others like Koch Bros. violating Iran sanctions within last decade (per Bloomberg Media) and deadly pipeline accidents through violations
3) Educational backgrounds of politicians over time vs. those of general background ('dem really smart politicians know what's best for me and mine - all my book learnin' is useless when compared to whores on the public and bankster dole)
4) Educational backgrounds of those espousing more training and education vs. those in general population who are unemployed (you know, Rush Limbaugh repeated college dropout and Hannity bashing the unemployed as losers who only know "basket weaving" and "art history" vs. Americans with BSs, PhD, MSs, etc. who are overqualified and unemployable)
5) Number of crimes committed by 1%ers like Dimon, Corzine (insider trading, market manipulation, raiding segregated funds, grand larceny, wire fraud, securities fraud) and Murdoch (FCPA, phone hacking, criminal conspiracy) that go uncharged vs. political contributions by said uncharged criminals (er, "best and brightest job creators").
6) Number of times CNN fixates on a certain non-economic story (e.g., shooting in Florida, Snooky leaving "Jersey Shore") correlated to poor economic news (-1 perfect inverse correlation I'm guessing)
Just some thoughts, I'm sure the DOJ, WH, Congress, FoxNews, CNN, and everyone else will willingly provide such information without much prodding - nothing to hide after all, nothing at all to hide.
Kurtz
Correction
Apologies, CNN fixation on non-economic stories is perfectly correlated to poor economic news, thus "1" and not "-1." I don't want to be accused of being an idiot unemployable "basket weaving major" by Rush or govt. official.
not sure exactly what you are trying to say
But yes, cable noise will pick a "non-story" story and hammer it, at least for a 24 hour cycle, drowning out all else.
On politics, those so called "news" shows simply get the party pundits, who are professionals, do this for a living, to parrot their pontificating noise of empty nothingness.
If you're talking about tech lobbyists plus India lining politicians pockets for more foreign guest worker visas in spite of a doubling of the unemployment rate for tech people and a decline in overall raw number of jobs (last I checked), no surprise there either.
Those are not reporters, they are paid operatives, glorified front people for lobbyists, who are in turn front people for various MNCs and special interests.
Why we call it cable noise, it's just a stream of bullshit and distraction techniques.
One of the reasons this site exists to boot, get the real data out there as best we can.