Noah Smith (at Bloomberg) recently wrote: "A plurality of Americans still consider themselves middle-class.” (A plurality meaning, more than any other, but not an absolute majority.) But he linked to The Guardian to make his case, which appears to be saying something completely different:
The rich get richer and income inequality in America continues to grow in 2013. The wage situation improved from 2012, but it's still pretty bad. The median wage was $28,031.02 in 2013 a paltry 1.9% increase from 2012. While the ratio of median wage to average wage improved, the 110 super rich are now earning 2595 times more than average workers.
The rich get richer and income inequality in America continues with no end in sight. The latest evidence is from the social security administration The gap between rich and the rest of us continues to grow.
Women are still low on the economic totem pole. A new Census report shows nothing has changed, women still make 77¢ to a male's dollar when both are working at full-time jobs and if one includes part-time, the ratio is even lower, 71¢. Worse than that, women with families and no husband around make the lowest median income of all, $34,002.
Did you know 15% of America lives in poverty and that income for households after adjusting for inflation has declined by 8.3% since 2007? That America is making 9% less in real dollars than in 1999? The latest annual Census report for 2012 shows America is still broken and poor.
There is another round of bad news for most Americans. A study shows the top 1% of America's rich captured 121% of the income gains for the two years after the 2007-2009 recession was declared over. U.C. Berkeley Economist Emmanuel Saez released his study Striking it Richer: The Evolution of Top Incomes in the United States early this month to much press. It truly is astounding. Gone is America's strong middle class where work was rewarded.
The attack on labor is in full throttle. We hear reports of outrageous pay for government workers with economic fictional spin. Pundits weave tall tales blaming the workers themselves as the reason for America's economic malaise. Actual wage statistics are never mentioned. Nor is the never ending income inequality in the United States and the policies which cause it.
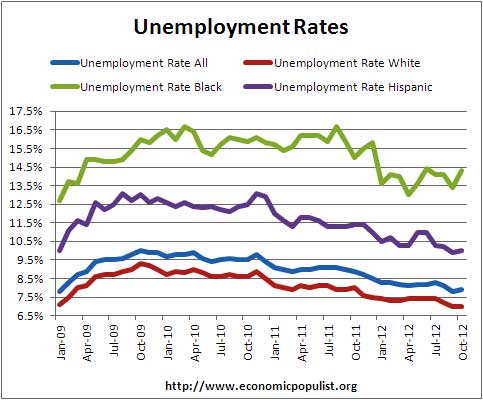
The election was won by identity politics. Black people voted for President Obama by over 93%, Hispanics 71% and Asians 73%. The exit polls show 55% of women voted for Obama, whereas 59% of white people voted for Romney. Ninety percent who thought the economy is good voted for Obama. Those who thought it is not so good voted for Romney by 60% margins.
Why Romney lost so big is a topic really outside our purview, yet we'll put in our 2¢ that it might be due to campaign rhetoric on policies promised. Unfortunately, there are words and there are deeds. What has the Obama administration done economically for the demographic groups who gave President Obama a second term?
A shocking claim was made by various press sources that those at the bottom of the American economic pile have living expenses which are double their income.
The bottom fifth of the U.S. income distribution -- 24.4 million households -- on average earned $10,074 in after-tax annual income and spent $22,001 last year,


Recent comments