
The rich get richer and income inequality in America continues with no end in sight. The latest evidence is from the social security administration The gap between rich and the rest of us continues to grow.
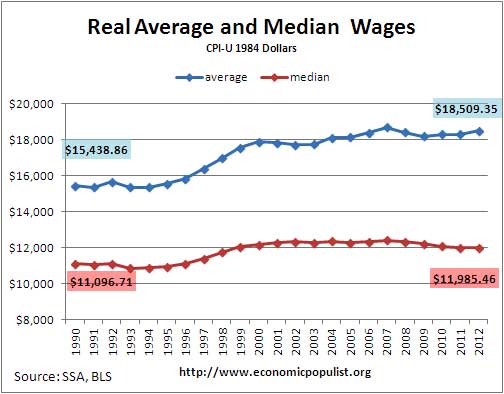
The social security administration keeps statistics on average and median wages as reported on Federal income taxes and contributions to deferred compensation plans. They use income tax data to calculate your social security benefits. Below is a chart of the average wage and median wage from 1990 to 2012. Median means 50% of all wage earners earned that wage or less.
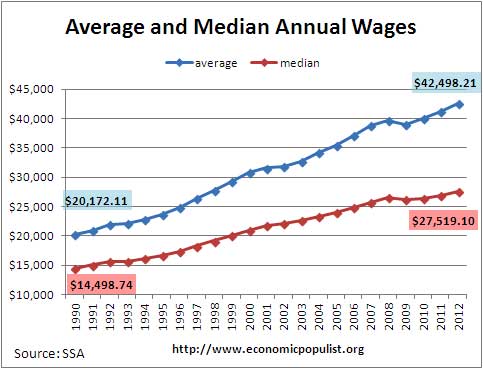
The average wage has increased 110.7% since 1990, yet the median wage has only increased 89.8%. The reason the average wage has increased more than the median is the super rich. Average wages are calculated by taking the total compensation in America and dividing by the number of wage earners. The reason the median and average wage diverge is because those few at the top making millions push the average wage amount much higher.
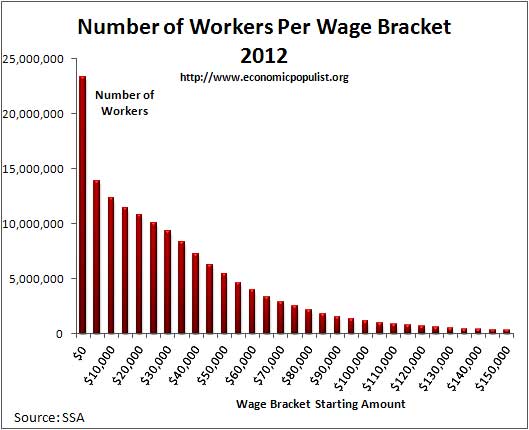
To see this disparity of how most of America is working for peanuts, below is a graph of wage earners by income bracket. A full 15.2% of wage earners make less than $5,000 per year. A whopping 24.2%, of all wage earners make less than $10,000 per year and almost a third, 32.2%, of American wage earners make under $15,000. Think about trying to rent a one bedroom apartment never mind feed oneself with these kinds of wages
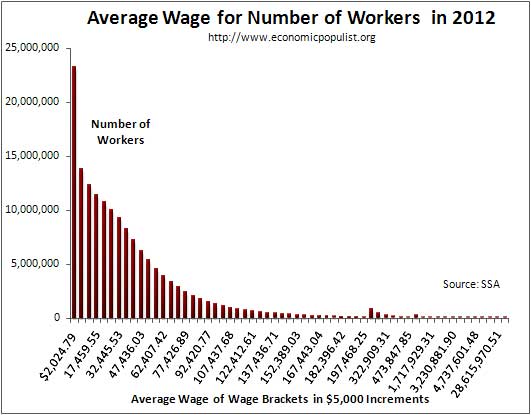
The average wage in these income brackets is also astounding. For those making less than $5,000 a year, the average wage is $2,024.79. For those making between $5 thousand and $10,000 the average wage is $7,406.32. That's 13.9 million people earning between $5,000 and less than $10,000 a year, right here in America with an astronomical 23,303,064 wage earners making less than $5,000 per year.
Welcome to the new feudal kingdom formally known as America. Income is so unequal we wonder if it compares to the days of the aristocracy and the proletariat. CEO worship and press articles glorifying their mansions, lifestyles and billions abound. Yet their lives have little to do with America for almost no one will ever see that kind of paycheck The reality is those earning less than a million dollars a year is 99.9% of all wage earners. More interesting 99% of us have only 86% of the total net compensation. Even more outrageous, 99.92% of wage earners have only 95.4% of the wage income in America. Most Americans make less than $30,000 a year. Yet 53.2% of wage earners only have 15.6% of the total net compensation.
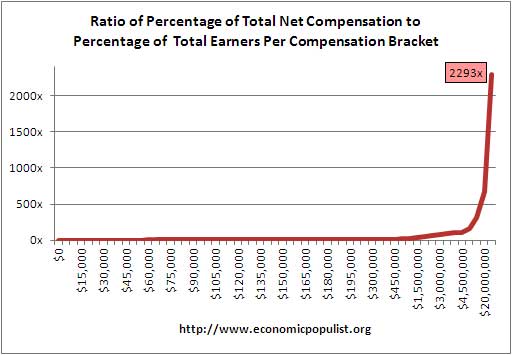
Below is a distribution graph, per compensation bracket, of the percentage of wage earners in that bracket (blue), vs. what the percentage of total compensation is for just that wage bracket (red). The chart shows, per wage bracket, how many people are in that wage range and what percentage of the total compensation pie they receive. If there was more income inequality in the United States we would see the blue bars matching the red ones. We do not. We see a few people in the $250 thousand or more income categories getting way more than their fair share of the total net compensation income pie.
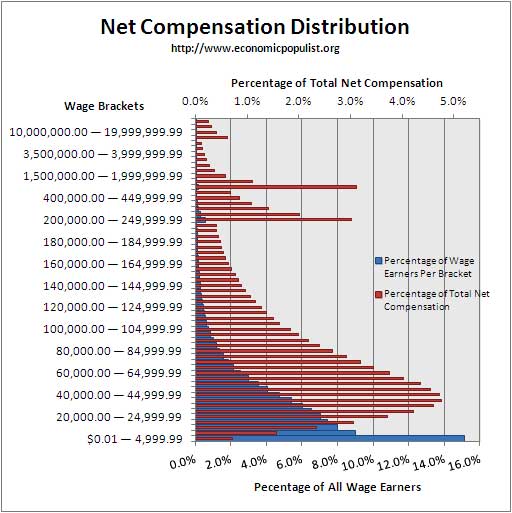
To put this in perspective, the top wage bracket is over $50 million and over. One hundred and sixteen people have net compensation at or above $50 million per year. As a percentage of total wage earners, these 116 individuals represent 0.00011% of the total income earners in 2012, an incredibly small number. Yet this special group of 116 received 0.25% of the total net compensation earned in 2012. That means as a group, these $50+ millionaires have 2293 times more money distributed to them as a population size than those earning $45,000 a year. Those making less than $5000 a year are only getting 0.7% of the total compensation pie, as a group This is income inequality as it's finest and is way worse than it was in 2011 as the $50 million plus club added 23 more income earners in 2012 and grabbed even more of America's income pie.
The super rich are grabbing so much of the income pie, they are biasing the average wage upward. The gap between the the median wage and the average is becoming increasingly larger as a result. For 2012 the average wage grew by 3.12%, yet the median wage increase only grew by 2.05%. This disparity again shows the super rich gaining even more income while the middle class gets a raise that barely meets annual inflation.
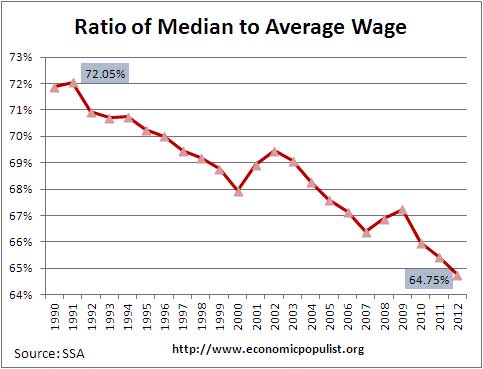
Below is a graph showing the ratio of the median wage to the average wage. In a space of two decades we see a significant downward slide. In 1991 the median wage was 72.05% of the average wage. By 2012 that percentage had slide all the way to 64.75%. This is a sure fire indicator the super rich are getting more and more wealthy while the rest of America struggles and earns peanuts.
If we take the same method the BLS uses to calculate real wages, which is to divide by CPI to account for inflation, we have an even more troubling story. Below is the average and median wage adjusted for inflation. When it comes to the average wage, it appears wages are keeping up with inflation. But once we take a look at the median wage, we see that is not the case. In other words the super rich are biasing the average wage figures so badly it appears wages are keeping up with inflation, but in the reality, they are not. Since 1990 wages beat inflation for CPI has increased 75.7% since that time, yet notice in the below graph what happens starting with the recession. The average wage has recovered to keep up with inflation from 2008, yet the median has not. Additionally the median real wage hasn't been this low since 1998, unlike the average wage.
The bottom line here is the rich are getting richer and most of America continues to get squeezed. More importantly, we have no idea how so many millions of America's working poor can even survive. These wages are simply not enough to live on. The median apartment rent is $736 a month or $8832 a year. Yet the median wage is $27,519.10 before taxes. Plug that figure into a federal tax estimator and smoke it. Even in a state with no taxes the take home pay is around $20,000 a year. This puts the median rent to be 44% of take home pay, way to high of a percentage to be going to the landlord.
It is no wonder America is in a cycle of perpetual debt and despair. The money to pay the bills has to come from somewhere and it sure ain't coming from people's employers as evidenced by these statistics.
The Social Security Administration defines net compensation here and it does include anything subject to taxes as reported on a W-2 by employers. We like to use these statistics for they come directly from tax records and thus are probably much more accurate than other estimates.
This article is an update on wages in America showing 2011 wage statistics. For more details of past 2010 wage data see our popular post, wages in America, most of us are have nots and article Wage statistics pain a bleak picture.
Recent comments