
The Federal Reserve's Industrial Production & Capacity Utilization report, G.17, shows zero change in industrial production for February 2012, but January was revised up, from 0% to 0.4%. Autos has some bad news, the auto & parts index dropped, -1.1% for February, but this is after autos had a meteoric soar of +8.6% in January. This report is also known as output for factories and mines.
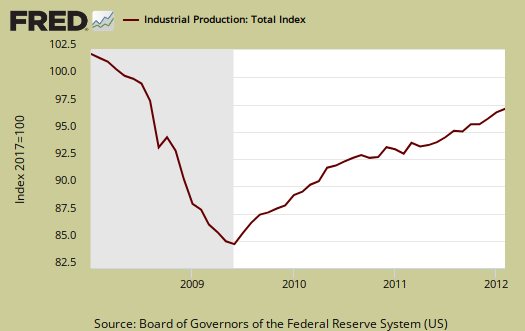
This month we can't blame the weather. Production at mines fell -1.2% while utilities were unchanged. While total industrial production has increased 4.0% from February 2011, the index is still down 3.8% from 2007 levels. Here are the major industry groups yearly industrial production percentage changes from a year ago.
- Manufacturing: +5.1%
- Mining: +6.1%
- Utilities: -5.6%
Below is the Fed's description of Market groups from the report and their monthly percent changes.
The production of consumer goods was unchanged in February. The index for durable consumer goods decreased 0.5 percent, as declines in the output of automotive products and of appliances, furniture, and carpeting were only partly offset by gains in the production of both home electronics and miscellaneous goods. The production of nondurable consumer goods edged up 0.1 percent. The index for consumer energy products rose 0.6 percent, with small gains in both fuels and residential utilities. The output of non-energy nondurable consumer goods was steady, as a step-up for foods and tobacco was offset by lower output for clothing, chemical products, and paper products.
In February, the production of business equipment rose 0.6 percent and was 10.8 percent above its year-earlier level. The index for information processing equipment moved up 1.0 percent last month for its third consecutive gain of 1 percent or more. The production of transit equipment increased 0.9 percent; over the 12 months ending in February, this index advanced 24.4 percent, with large gains in the output of trucks, civilian aircraft, railroad rolling stock, and miscellaneous transportation equipment. The output of industrial and other equipment increased 0.2 percent in February, its seventh consecutive monthly rise.
The index for defense and space equipment advanced 1.1 percent in February following a gain of 0.8 percent in January.
The production of construction supplies rose 1.1 percent in February. This index has advanced 7.5 percent over the past 12 months but nevertheless remained more than 20 percent below its level preceding the recession. The index for business supplies moved up 0.2 percent in February after a similarly sized gain in January.
The output of materials to be further processed in the industrial sector moved down 0.3 percent in February. The index for durable materials was up 0.5 percent after having advanced 1 percent or more in each of the three previous months. Among the major categories of durable materials, both equipment parts and other durable materials rose in February, but consumer parts fell. The production of nondurable materials decreased 0.3 percent, with losses in chemical materials partly offset by increases for both textile and paper materials. The output index for energy materials fell 0.9 percent, its third consecutive monthly decline.
Manufacturing increased 0.3% in February, 0.4% if one takes out autos & parts. Manufacturing in January was significantly revised, from 0.4% to 1.1%. Below is a graph of just the manufacturing index, part of industrial production.

The drop in mining production is due to less natural gas extraction and coal production.
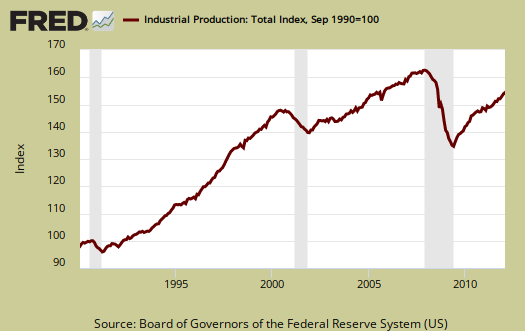
Below is another graph of industrial production since September 1990, indexed to that month. Look at the slope, the growth through the 1990's and then compare to 2000 decade. It was in 2000 when the China trade agreement kicked in and labor arbitrage of engineers, advanced R&D, I.T., STEM started in earnest.
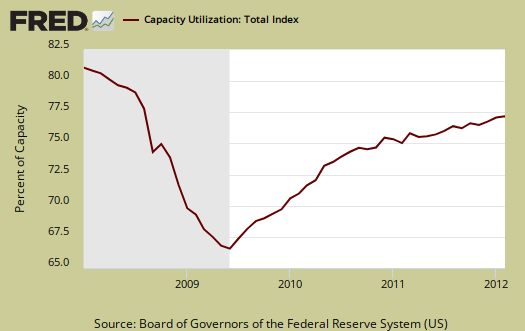
Capacity utilization, or of raw capacity, how much is being used, for total industry is now 78.7%, a -1.6 percentage points below the average from 1972 to 2011, 80.3%. Capacity growth overall has increased 1.2 percentage points from February 2011.
Capacity utilization is how much can we make vs. how much are we currently using, of what capacity is available now. Capacity utilization is industrial production divided by raw capacity. This month capacity utilization edged down a 10th of a percentage point to 78.7%. The U.S. is still not producing what it is capable of, a reflection of the output gap, (although only in war would one reach 100% capacity).
According to the report, manufacturing uses 76.91% of capacity, utilities 10.55% and mining 12.54% in 2011.
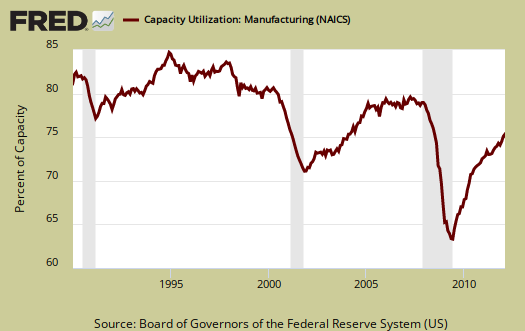
Below is the Manufacturing capacity utilization graph, normalized to 2007 raw capacity levels, going back to the 1990's. Too often the focus is on the monthly percent change, so it's important to compare capacity utilization to pre-recession levels and also when the economy was more humming.
Capacity, on the other hand, is the overall level of plants, production facilities, and ability to make stuff, that we currently have in the United States. Think about a new factory being built, or a factory shut down and it's machinery sold at auction and shipped to China. This is capacity.
The Federal Reserve releases detailed tables for more data, metrics not mentioned in this overview.
If you are baffled by what crude, finished mean from the G.17 report, read these stages of production definitions.
This overview is truncated. On March 30th, the Federal Reserve will release their annual benchmark revisions based on actual 2010 IP and Q4 2011 capacity surveys. We expect capacity to be revised downward, but regardless, we'll be overviewing the benchmark revisions in detail when they are released along with some annual growth (or contraction) rates and industry sector breakdowns. The point is don't get emotionally attached to the February statistics, for benchmark revisions are coming in two weeks.
Here is our industrial production report overview from last month, unrevised, which has automotive and technology graphs from the unrevised January statistics.
Productivity hypothesis called into question
There' a Washington Post/Bloomberg Business (Peter Whoriskey, 19 March 2012) article going around citing studies by Information Technology and Innovation Foundation (ITIF). Economists are coming forward to counter the meme that low employment in manufacturing should be seen as a success story (based on that low employment is presented as tied to increased per-worker productivity).
"I bought into this idea for a long time that it was superior labor productivity that caused most manufacturing job losses," said Rob Atkinson, of ITIF. "Then I began to dig into the numbers."
Susan Houseman (W.E. Upjohn Institute) has co-authored a paper with three Federal Reserve economists, raising questions about the productivity numbers' accuracy.
Excerpted for review purposes from 'Economists offer more pessimistic view in upcoming reports' (WaPo/Bloomberg article by Peter Whoriskey) --
WaPo/Bloomberg article also carried by McClatchey Newspapers.
Thanks for pointing out this paper
I will probably overview it here. I covered earlier work by Susan Houseman, Productivity, GDP and outsourcing.
The BLS productivity report I've had issues tracking on the numbers. One thing they use a special research CPI index on some calculations, and there is another statistical report by the BEA which to me also denies outsourcing is a problem.
My thing is to track data and while I intuitively know something is wrong with some statistical releases, I cannot seem to drill down enough in the numbers to pull it out and quantify it.
But this is important. Denying offshore outsourcing is hurting the economy is a huge deal! There are a lot of vested interests, who don't want that to be "true".
WaPo man, they don't even link to the papers or give their full titles. What kind of reporting is that? ;)