
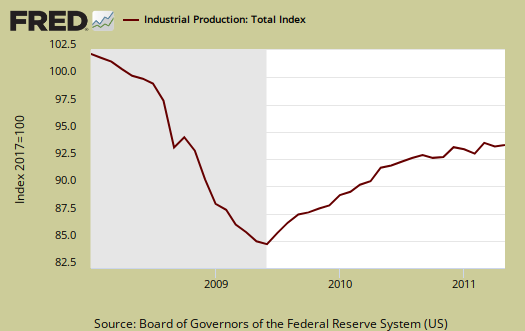
The Federal Reserve's Factory Production report shows a measly 0.1% increase for May 2011 Industrial Production, otherwise known as output for factories and mines. Manufacturing industrial production rose 0.4% yet had dropped -0.5% in April. Japan is still affecting autos and without them, which declined -0.5%, manufacturing would have increased +0.6%. April would have been only a -0.1% drop and they note the terrible tornadoes in the South affecting manufacturing. Industrial production is still down -7% from pre-recession levels, in other words going on 4 years. Here is the Federal Reserve's detailed report.
Here are the major industry groups monthly industrial production percentage changes.
- Manufacturing: +0.4%
- Mining: +0.5%
- Utilities: -2.8%
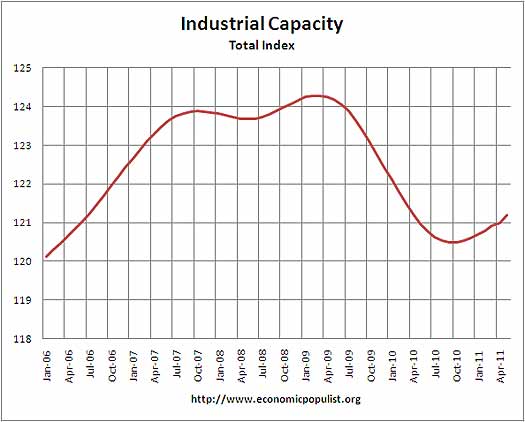
Below is the graph of raw capacity, indexed against 2007 output. This is just how much capacity does the U.S. have to make stuff. Look at how total capacity has declined for the first time in the historical data. This index represents the raw facilities, potential to make stuff. Raw capacity is the underlying number by which utilization is calculated. This month capacity increased +0.2.
Below is the Fed's description of Market groups from the report and their monthly percent changes. Construction supplies is still 25% below it's peak. We also are seeing the effects of the Japan disaster on global supply chain.
The production of consumer goods edged down 0.1 percent in May after having been unchanged in April. Within consumer goods, the index for durables rose 0.2 percent, while the index for nondurables declined 0.2 percent. Among durable goods categories, the output of automotive products fell 0.5 percent, but the indexes for its other major components increased: The output of home electronics advanced 1.7 percent; the output of appliances, furniture, and carpeting rose 1.8 percent; and the index for miscellaneous consumer durables increased 0.7 percent. The decrease in consumer nondurables reflected a drop in residential sales by utilities; elsewhere, the output of fuels advanced and the production of non-energy nondurable goods edged up. Among non-energy nondurables, the indexes for clothing, chemical products, and paper products all increased by about 0.75%, but the index for foods and tobacco decreased nearly -0.5%.
The output of business equipment rose 1.2 percent in May after 2 months of declines; the index has advanced 9.2 percent over the past 12 months. Sizable gains were recorded both in May and over the past year for all of the major components of business equipment: transit equipment, information processing equipment, and industrial and other equipment. The increase for industrial and other equipment in May was the first substantial gain in this index since January.
The production index for defense and space equipment rose 0.9 percent in May after having been unchanged in each of the previous two months. This index stands 2.5 percent above its year-earlier level.
Among nonindustrial supplies, the output of construction supplies rose 1.4 percent in May. This index is more than 10 percent above its 2009 trough but remains more than 25 percent below its pre-recession peak. The production of business supplies fell 0.3 percent in May; this index stands only about 3 percent above its 2009 trough and more than 13 percent below its pre-recession peak.
The output of materials to be processed further in the industrial sector edged down 0.1 percent for a second consecutive month in May. The output of durable materials rose 0.4 percent in May; a decline of 0.4 percent in consumer parts was more than offset by an increase of 0.7 percent in equipment parts and a gain of 0.4 percent in other durable materials. The output of nondurable materials moved up 0.4 percent after having fallen 0.9 percent in April. The increase in nondurable materials in May was due to a sizable increase for textile materials and a gain for chemical materials; the output of paper materials was unchanged in May. The index for energy materials declined 0.8 percent, with decreases for both primary energy and converted fuel.
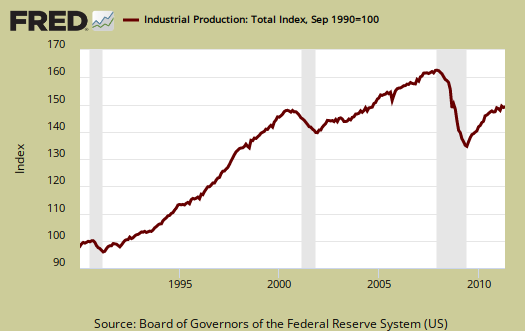
Below is another graph of industrial production since September 1990, indexed to that month. Look at the slope, the growth through the 1990's and then compare to 2000 decade. It was in 2000 when the China trade agreement kicked in and labor arbitrage of engineers, advanced R&D, I.T., STEM started in earnest.
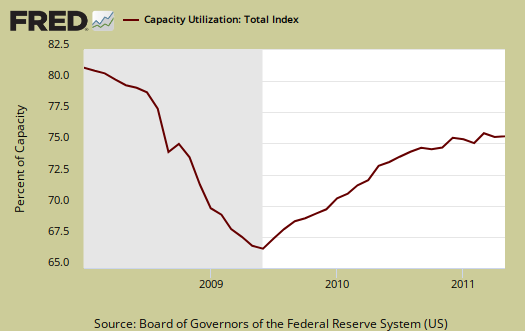
Capacity utilization, or of raw capacity, how much is being used, for total industry is now 76.7%. But the Fed notes this is 3.6 percentage points below the average from 1972 to 2010, 80.4%. Manufacturing capacity utilization was 74.5%.
Below are capacity utilization's monthly percent change breakdown.
- manufacturing: +0.3%
- mining: +0.3%
- utilities: -2.4%
- selected high-technology industries: 0%
- crude: +0%
- primary: -0.2%
- finished: +0.2%
The below graphs show the overall decline of U.S. capacity utilization. Capacity utilization is how much can we make vs. how much are we currently using. These graphs show the U.S. is simply not producing what it is capable of, a reflection of the output gap. Note, this index is normalized to a specific year, currently from most reports, the 2007 yearly average (see year in the graph). Therefore, one cannot take absolute values of capacity utilization, i.e. 80%, and claim this is an indicator of a healthy economy, for it all depends on what year capacity utilization is normalized to. One can take the slope, or rate of change from the peak of a recession and determine recovery, but again, these percentages are relative, they are not absolute ratios to a static point in time. Also recall utilization is a percentage of real total capacity. Notice that total capacity in the United States has declined.
According to the report, manufacturing uses 77.8% of capacity, utilities 10.4% and mining 11.8%.
Below is the Manufacturing capacity utilization graph, normalized to 2007 raw capacity levels, going back to the 1990's. Too often the focus is on the monthly percent change, so it's important to compare capacity utilization to pre-recession levels and also when the economy was more humming.

This report doesn't indicate a contraction, yet seems to defy other manufacturing reports of recent, so don't be surprised if it is revised downward.
If you are baffled by what crude, finished mean, read these stages of production definitions.
The Federal Reserve releases detailed tables for more data, metrics not mentioned in this overview.
Recent comments