
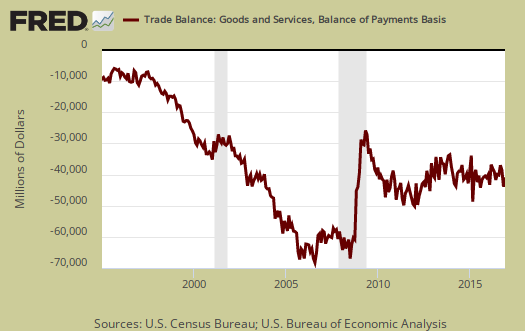
The U.S. December 2016 monthly trade deficit decreased 3.2% from last month and now stands at $44.3 billion. For all of 2016, the trade deficit increased 0.4% from the year previous. While that doesn't sound like much, the total amount is -$502.3 billion. This is in spite of petroleum imports being much less of a trade deficit factor. China alone is almost half of the trade deficit. While pundits proclaim Trump will start a trade war, with these kind of figures, surely that war is long over and America obviously surrendered.
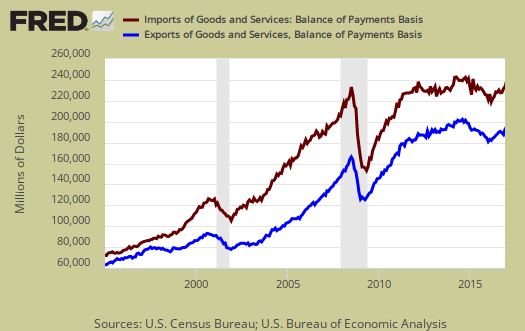
Graphed below are imports and exports graphed and by volume since 1995 and note the global trade collapse in 2009. For the year the goods trade deficit decreased by -1.6% to $750.1 billion while the services surplus shrank by -5.5% to be $247.8 billion. Imports are in maroon and exports are shown in blue, both scaled to the left.
Below are the goods import monthly changes, seasonally adjusted. On a Census basis, overall imports increased by $3.7 billion to $187.241 billion. Passenger car imports was $1.351 billion more in just a month to $15.3 billion. Imported passenger cars now exceeds crude oil imports, which were slightly over $10 billion.
- Industrial supplies and materials: +$1.092 billion
- Capital goods: +$0.982 billion
- Foods, feeds, and beverages: -$0.157 billion
- Automotive vehicles, parts, and engines: -$1.617 billion
- Consumer goods: +$0.142 billion
- Other goods: -$0.291 billion
Below is the list of good export monthly changes, seasonally adjusted, by end use and on a Census accounting basis, increased by $4.933 billion to $126.581 billion. The reason for the good showing is an almost two billion dollar increase in aircraft and aircraft engines exports.
- Automotive vehicles, parts, and engines: +$0.167 billion
- Industrial supplies and materials: +$0.731 billion
- Foods, feeds, and beverages: -$0.095 billion
- Capital goods: +$3,332 billion
- Consumer goods: +$0.722 billion
- Other goods: +$0.618 billion
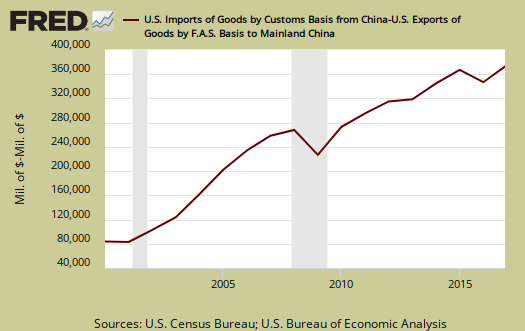
The China trade deficit is always the largest trade deficit of any other nation by a long shot. December saw a seasonally adjusted $30.192 billion China trade deficit The China trade deficit for 2016 actually decreased $20.1 billion due to $20.4 billion less in imports. but it is still a massive $347 billion. This is 47% of the total goods trade deficit. The annual 2015 the trade deficit with China was $367.2 billion. The below graph shows monstrous annual trade deficit with China.
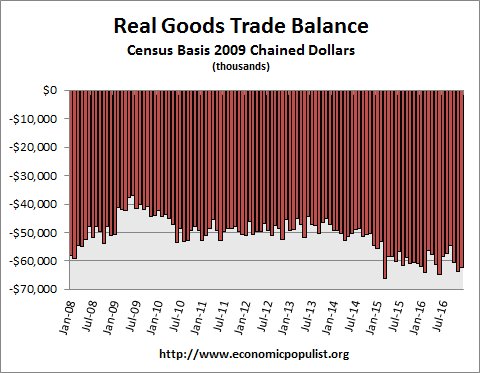
In real dollars, or adjusted for inflation, the goods trade deficit on a Census basis decreased by -$1.56 billion to -$62.308 billion. The trade deficit continues to gobble up the U.S. economy. Real valued trade figures are part of GDP. Annually, the trade deficit was 2.7% of GDP in 2016. In 2015 the trade deficit was 2.8%.
Oil or real valued petroleum trade deficit has just plummeted and is now a monthly -$9.495 billion for December. This is a drop of 9.5% from November. Real means the balance figures are adjusted prices using chained 2009 dollars so inflation is not in the mix. Not seasonally adjusted a barrel of crude was $41.45 and barrels for the month were 238,333.
If we take the real valued end use of petroleum versus non-petroleum of the goods trade deficit, we see petroleum as a percentage of the trade deficit continues to plunge. One thing is clear as a trend, petroleum is less and less of a trade deficit issue. Below is a graph of petroleum end use deficit as a percentage of the goods trade balance and this breakdown is by the Census accounting method and in 2009 chained dollars.

If the Trump administration gets serious on bad trade deals, there should be movement in the trade figures. That said, this is pretty awful, so honestly, how could it get much worse? It could instead get better. Here are other trade deficit overviews, data unrevised.
GDP revisions resulting from this trade report
November trade deficit was revised higher from the originally reported $45.24 billion to $45.73 billion, and trade figures for every prior month of 2016 were also revised, meaning that prior quarter over quarter figures for GDP will have to be revised as well...in the advance report on 4th quarter GDP of two weeks ago, our December trade deficit was estimated based on the sketchy Advance Report on our International Trade in Goods which was released just before the GDP release...that report estimated that our December goods trade deficit was at $65.0 million, on goods exports of $125.5 billion and goods imports of $190.5 billion...this report revises that and shows that our actual goods trade deficit in December was at $65.7 billion on adjusted goods imports of $192.6 billion and adjusted goods exports of $126.9 billion...in addition, the November trade deficit was revised higher by nearly $0.5 billion…just those two revisions from the previously published data mean that the 4th quarter trade deficit in goods was roughly $1.2 billion more than was included in last week's GDP report, or roughly $4.9 billion on an annualized basis, which would subtract about 0.11 percentage points from 4th quarter GDP....
however, trade in goods for July, August, September and October, which all go into figuring the change in GDP, were also revised with this report as well...to assess those changes, we can view the all previously published trade details in the pdf for November's trade report, and then compare them to the revised numbers in the pdf for December's trade report....without going into too much detail or attempting to adjust for fractional inflation factors, the net trade deficit for July was revised from $39,626 million to $39,977 million, the net trade deficit for August was revised from $39,626 million to $39,977 million, the net trade deficit for September was revised from $39,626 million to $39,977 million, and the net trade deficit for October was revised from $39,626 million to $39,977 million...that means the trade deficit in the 3rd quarter was roughly $1.05 billion more than was reported by the GDP report, which they would have reported at a $4.2 billion annual rate, and hence the change in the deficit from the 3rd quarter to the 4th quarter was that much smaller ...those 3rd quarter revisions would thus add about 0.10 percentage points back to the change 4th quarter GDP, ie, make it less negative than was reported in the advance report...
rjs