
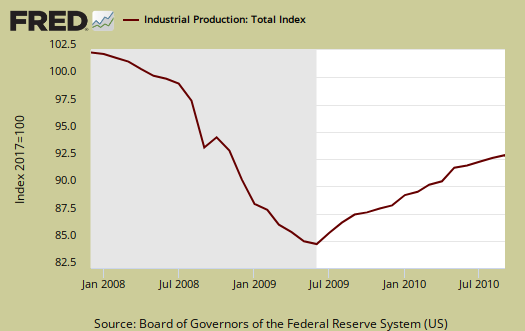
The Federal Reserve's Factory Production report shows a -0.2% decrease for September 2010 in Industrial Production. Here is a detailed report. Here's something not good, although the Fed is referring to the slowdown in growth, Industrial Production is up 3.6% for Q3 2010. Below is a quote from the report:
The index for manufacturing decelerated sharply in the third quarter
Major industry groups breakdown of industrial production.
- manufacturing: -0.2%
- mining: +0.7%
- utilities: -1.9%
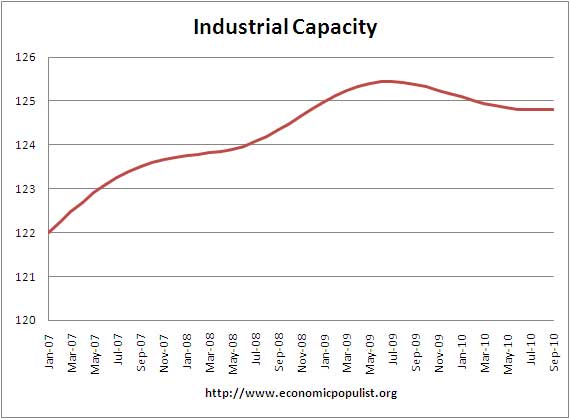
Below is the graph of total raw capacity, indexed against 2007. This is just how much capacity does the U.S. have to make stuff. Not just how much is the United States production facilities utilizing, but what is it's potential? Utilization is a ratio, where raw capacity is the underlying number by which utilization is calculated. You can see it's flat, not growing. Where are the plants being built? China? India? Brazil? Manufacturing capacity, a subset of total capacity, has been unchanged, at 125.5 for 6 months.
It appears construction dragged down the industrial production index, along with nonindustrial supplies. Business supplies dropped -0.9% for September. Last month construction supplies were 1.1% growth.
For industrial production the marketing group major changes are (monthly rate):
- Final Products: -0.2%
- Consumer goods: -0.4%
- Business equipment: +0.1%
- Nonindustrial supplies: -0.9%
- Construction: -0.8%
- Materials: +0.4%
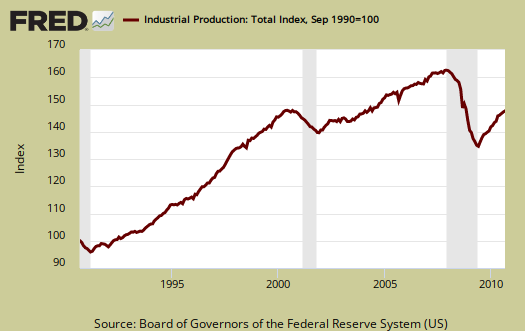
Below is industrial production since September 1990, indexed to that month. Look at the slope, the growth through the 1990's and then compare to 2000 decade. It was in 2000 when the China trade agreement kicked in and labor arbitrage of engineers, advanced R&D started.
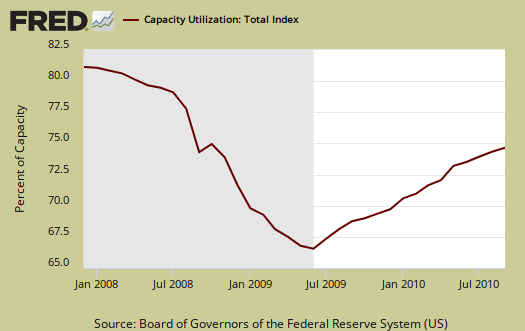
Capacity utilization, or of raw capacity, how much is being used, decreased to 74.7%, from last month's 74.8% (revised). Below are capacity utilization's monthly percent change breakdown. It is unclear if these values are annualized, so consider them raw monthly percentage changes.
- manufacturing: -0.1%
- durable: -0.2%
- non-durable: +0.1%
- mining: +0.5%
- utilities: -1.5%
- Selected high-technology industries: -0.2%
- crude: +0.7%
- primary: -0.4%
- finished: -0.1%
The below graphs show the overall decline of U.S. capacity utilization. Capacity utilization is how much can we make vs. how much are we using. These graphs show the U.S. is simply not producing what it is capable of, a reflection of the output gap. Note, this index is normalized to a specific year, currently from most reports, the 2007 yearly average (see year in the graph). Therefore, one cannot take absolute values of capacity utilization, i.e. 80%, and claim this is an indicator of a healthy economy, for it all depends on what year capacity utilization is normalized to. One can take the slope, or change from the peak of a recession and determine recovery, but again, these percentages are relative, they are not absolute ratios to a static point in time. Also recall utilization is a percentage of real total capacity. Notice that total capacity in the United States has declined.
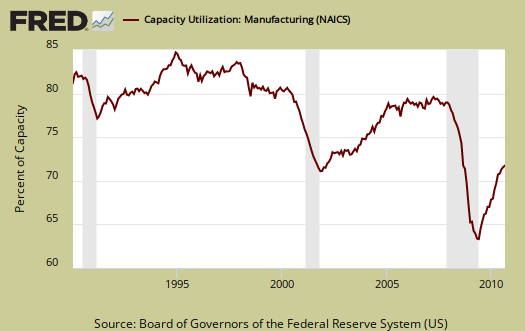
Below is the Manufacturing capacity utilization graph, normalized to 2007 raw capacity levels, going back to the 1990's. Too often the focus is on the monthly percent change, so it's important to compare capacity utilization to pre-recession levels and also when the economy was more humming.
Durable materials had it's first decline since 2009. Here are some more details on industrial production categories from the Federal Reserve:
The output of consumer goods declined 0.4 percent in September. The index for consumer durables decreased 0.9 percent. Within durables, the output of automotive products fell 1.0 percent, the index for appliances, furniture, and carpeting dropped 1.9 percent after a similarly sized decline in August, and the production of miscellaneous goods declined for a second consecutive month. The output of home electronics rose 0.6 percent. The production of nondurable consumer goods moved down 0.2 percent; a fall of 1.9 percent in the energy category, which primarily resulted from a decrease in the index for residential utilities, more than offset an increase in the non-energy category. Within non-energy nondurables, the indexes for foods and tobacco and for clothing moved up, while the indexes for chemical products and for paper products moved down. The output of consumer goods increased faster in the third quarter than in the second quarter, a pickup that reflected unusually strong summer sales by utilities and a jump in the output of consumer automotive products.
The output of business equipment edged up 0.1 percent in September and was 10.1 percent above its year-earlier level. The index for transit equipment advanced 1.8 percent and offset a decline in the production of information processing equipment; the output of industrial and other equipment was unchanged. For the third quarter, the output of business equipment rose at an annual rate of 9.8 percent. This increase was slower than in the second quarter due to substantial decelerations in the indexes for information processing equipment and for industrial and other equipment. In contrast, the output of transit equipment jumped at an annual rate of 33.4 percent in the third quarter after having fallen the previous two quarters.
If you are baffled by what crude, finished mean, read these stages of production definitions.
Last month's overview of the Industrial Production economic report unrevised is here. The Federal Reserve releases detailed tables for more data, metrics not mentioned in this overview.
Angry Bear Says
industrial production numbers point to no job growth.
I agree, and to begin with, manufacturing job growth as been in contraction, or just barely above breaking even. This is from not only the BLS, but the ISM and regional Fed survey reports.
To Angry Bear: What is the deal with your login requirements to post a comment? I tried 9 times and have twitter accounts, Google accounts and still couldn't write something. Gez, Louise, enable anonymous comments or something there and yes I know referrer spam is a bitch. ;)