
The Federal Reserve Industrial Production & Capacity Utilization report reversed itself from last month and had a 0.7% blowout. March though was revised downward to a -0.9% decline. Mining is still repressed but manufacturing showed signs of life for the month. Utilities increase due to the return to seasonal weather from last month. The G.17 industrial production statistical release is also known as output for factories and mines.
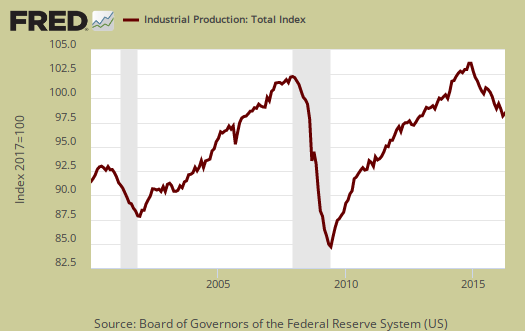
Total industrial production has now decreased -1.1% from a year ago. Currently industrial production is now 4.1 percentage points above the 2012 average. Below is graph of overall industrial production's percent change from a year ago. Notice how closely industrial production follows the grey recession bars.
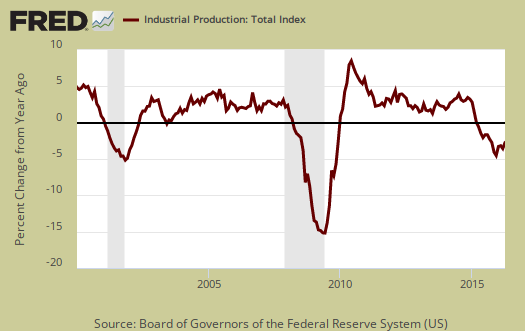
Here are the major industry groups industrial production percentage changes from a year ago. The percentages for mining have dropped -1.5 percentage points on average for the last eight months.
- Manufacturing: +0.4%
- Mining: -13.4%
- Utilities: +0.4%
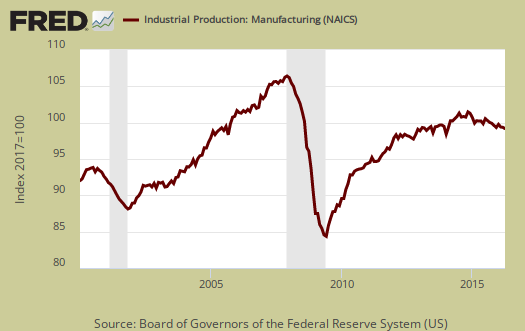
For the month manufacturing overall increased by 0.3%. For the last three months manufacturing gains are zero. February was no change and March showed a -0.3% decline. Manufacturing output is 3.4 percentage points above its 2012 Levels and is shown in the below graph.
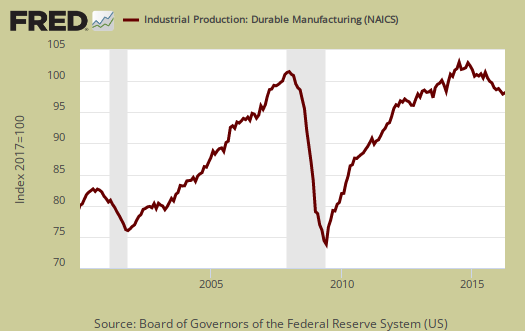
Within manufacturing, durable goods had a 0.6% monthly increase. Machinery gained 2.4% and Motor vehicles & parts increased 1.3% for the month. Primary metals, on the other hand, declined 1.2%.
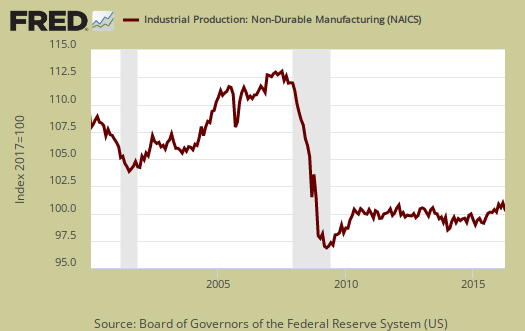
Nondurable goods manufacturing unchanged percentage points for the month. Food, beverages and tobacco had a 0.6% increase, plastics 0.4% while others decreased. Apparel and leather declined -2.3% for the month and is down -8.3% for the year.
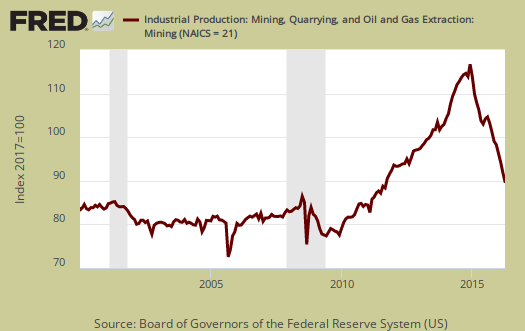
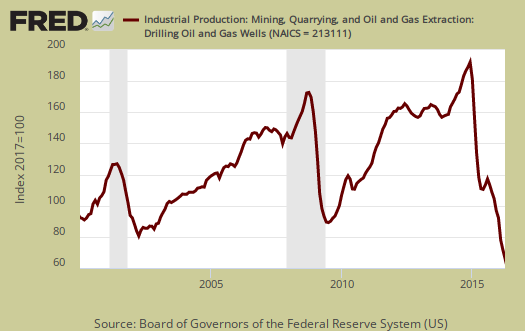
Mining decreased -2.3% and is now down -13.4% for the year. Mining includes gas and electricity production and the Fed have a special aggregate index for oil and gas well drilling. Oil and gas well drilling decreased -6.8% for the month and for the year is down -51.7%. Coal by itself declined over -40% in the past year.
Below is oil and gas well drilling to show the incredible bust in production.
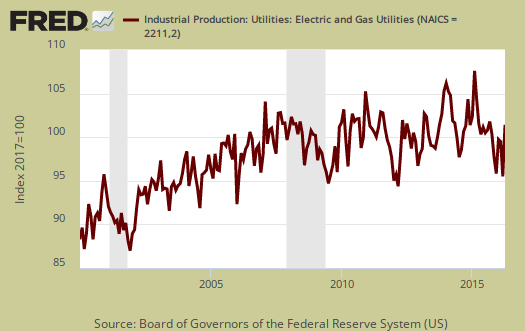
Utilities soared by 5.8% and this is the largest monthly increase since February 2007. Electric utilities increased 5.4% and gas utilities increased 9.3%. Utilities are often volatile due to changes in weather, as shown below.
There are two reporting methodologies in the industrial production statistical release, market groups and industry groups. Market groups is output bundled together by market categories, such as business equipment or consumer goods and shown below:
The indexes for all major market groups either increased or were unchanged in April. The rise in the output of utilities contributed significantly to gains in the indexes for consumer goods, business supplies, and materials through their energy components. Among consumer goods, the output of durables rose 1.3 percent, and the production of non-energy nondurables moved up 0.3 percent. The increase for non-energy nondurables reflected gains for foods and tobacco and for chemical products that were partly offset by decreases for clothing and paper. The production of business equipment advanced 0.8 percent, mostly because of a sizable increase for industrial and other equipment. The indexes for defense and space equipment, construction supplies, and non-energy business supplies were little changed. The output of non-energy materials moved up 0.1 percent as a result of an increase in its durable component; the production of nondurable materials edged down.
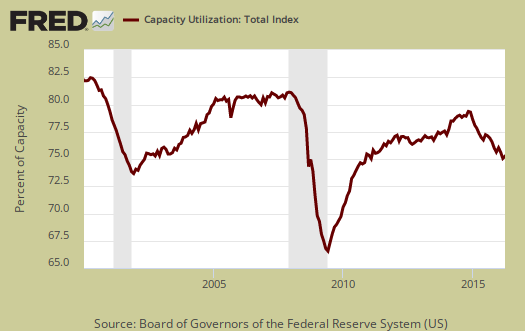
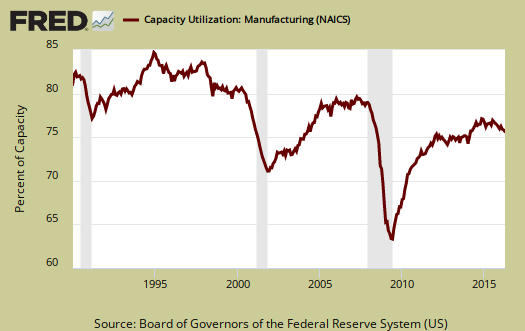
Capacity utilization, or how much raw capacity being used, for total industry is 75.4%, an increase of 0.5 percentage points from last month. . Capacity utilization has decreased by -1.5 percentage points from a year ago and is 4.6 percentage points below the long run average. That's better than last month but still not good. Manufacturing capacity utilization increased 0.2 percentage points for the month, is 75.3% and is 3.2 percentage points below it's long run average. Manufacturing capacity uptick was all durables, which increased 0.4 percentage points for the month. Mining capacity utilization dropped to 72.5%, which is the lowest it has ever been. Mining capacity has also declined 11.8 percentage points from just a year ago. Utilities use of it's capacity is 78.6% and this is a massive monthly increase of 4.2 percentage points.
Capacity utilization is how much can we make vs. how much are we currently using, of what capacity is available now, or output rate. Capacity utilization is also called the operating rate. Capacity utilization is industrial production divided by raw capacity.
Capacity growth is raw capacity and not to be confused what what is being utilized. Instead, this is the actual growth or potential to produce. Capacity is the overall level of plants, production facilities, and ability to make stuff, that we currently have in the United States. Capacity growth overall has increased 1.0 percentage points from a year ago. Below is the capacity growth increase from a year ago of the subcategories which make up industrial production.
- Manufacturing: +0.8%
- Mining: +0.6%
- Utilities: +0.6%
Below is the Manufacturing capacity utilization graph and notice how the 2001-2003 time frame starts to slide as manufacturing goes offshore in a series of bad trade treaties.
Overall while this month's report sounds like an improvement, it's really not. Utilities swing quite a bit and manufacturing simply balanced itself out as having no real growth. Mining is still imploding and the decline in capacity utilization is quite disconcerting. Here are our previous overviews, only graphs revised. The Federal Reserve releases detailed tables for more data, metrics not mentioned in this overview.
Recent comments