
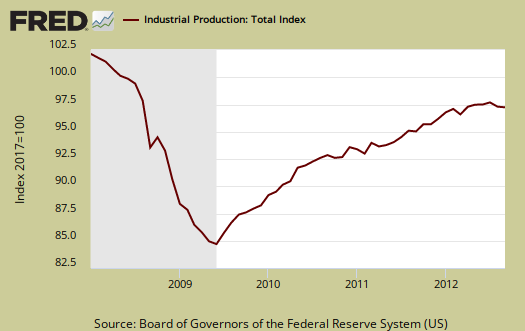
The Federal Reserve's Industrial Production & Capacity Utilization report, G.17, shows a increase of 0.4% in industrial production for September 2012. This report is also known as output for factories and mines. Manufacturing increased 0.2%, mining 0.9% and utilities increased 1.5%. Oil and gas Gulf of Mexico rigs resuming are mentioned in the 0.9% output of mines increase. Some had temporarily shut down for Hurricane Issac in August.
Roughly 0.3 percentage point of the decline in overall industrial production in August reflected the effect of precautionary idling of production in late August along the Gulf of Mexico in anticipation of Hurricane Isaac, and part of the rise in September is a result of the subsequent resumption of activity at idled facilities.
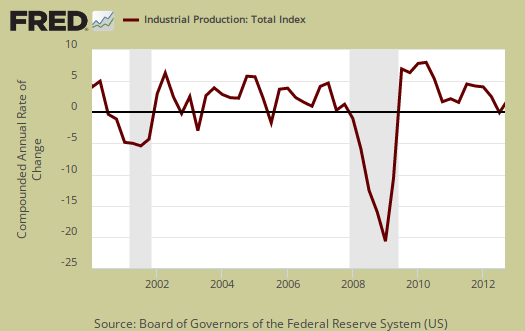
For the quarter industrial production has declined -0.4%, annualized. This is the first quarterly drop since Q2 2009, when the country was still mired in recession and industrial production declined -11.4%. Below is a quarterly annualized percentage change of industrial production and we can see a decline matches with recessionary periods.
Total industrial production has increased 2.8% from August 2011 and is still down -3.0% from 2007 levels, that's right, five years. Here are the major industry groups yearly industrial production percentage changes from a year ago. Utilities are fairly surprising, considering the drought and heat domes of this year, although there was also an unusually warm winter.
- Manufacturing: +3.2%
- Mining: +3.8%
- Utilities: -1.4%
Below is the Fed's description of Market groups from the report and their monthly percent changes.
The production of consumer goods was unchanged in September after having fallen 1.5 percent in August. For the third quarter as a whole, output moved down at an annual rate of 0.8 percent, as a decline in durable goods more than offset an increase in nondurables. For September, the output of durable goods dropped 1.7 percent. Among durable consumer goods categories, the production of automotive products fell 2.9 percent, a second consecutive large decline. The indexes for home electronics and for miscellaneous goods posted smaller declines, and the index for appliances, furniture and carpeting moved up. The production of nondurables advanced 0.6 percent, with increases in the output of both energy products and non-energy goods. The index for consumer energy products rose 0.8 percent after having fallen 2.7 percent in August; within the non-energy category, where production increased 0.5 percent in September, there were gains in the indexes for foods and tobacco and for clothing, while the indexes for chemical products and for paper products declined.
The output of business equipment moved up 0.8 percent in September and was nearly 11 percent above its year-earlier level. In the third quarter, the production of business equipment advanced at an annual rate of 4.6 percent, appreciably slower than its gain of 12.1 percent in the second quarter. The production of transit equipment rose 1.7 percent in September after having dropped 3.3 percent in August; the gain in September was boosted by an increase in the production of civilian aircraft. The output of information processing equipment moved up 0.5 percent, while the index for industrial and other equipment increased 0.4 percent.
The output of defense and space equipment gained 1.7 percent in September. For the third quarter, the index rose at an annual rate of 7.0 percent, which more than reversed a decline of 5.7 percent in the second quarter.
Among nonindustrial supplies, the output of construction supplies moved up 1.3 percent in September, but it decreased at an annual rate of 3.5 percent in the third quarter for its second consecutive quarterly decline. The production of business supplies rose 0.4 percent in September after having fallen 1.3 percent in August; the index moved down at an annual rate of 1.7 percent in the third quarter.
The output of materials to be processed further in the industrial sector rose 0.4 percent in September after having declined 1.6 percent in August. The index for materials moved down at an annual rate of 0.9 percent in the third quarter; decreases in durable materials and in energy materials more than offset an increase in nondurable materials. The output of durable materials edged down 0.1 percent in September. Consumer parts fell noticeably for a second month; nevertheless, in September, the index stood 16.5 percent above its year-earlier level. The output of equipment parts moved up 0.4 percent in September after having declined 2 percent or more in July and in August. In September, the production of nondurable materials advanced 0.6 percent. The indexes for textiles and for chemicals increased, while the production of paper moved down. The output of energy materials rose 0.9 percent following a large drop in August that was driven by decreases in oil and natural gas extraction related to Hurricane Isaac.
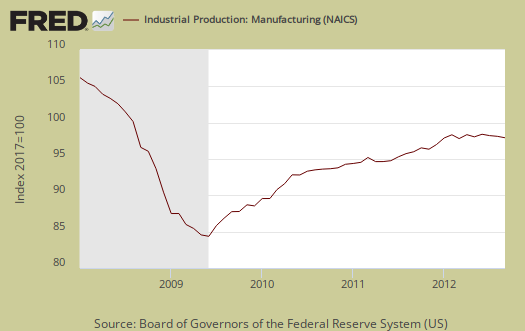
Below is a graph of just the manufacturing portion of industrial production.
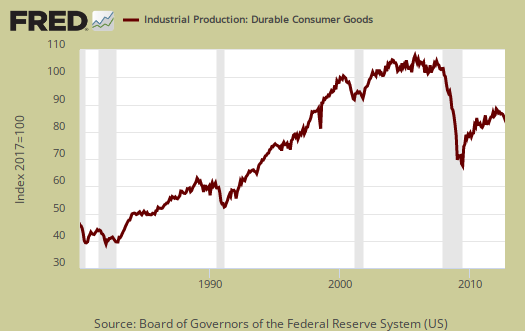
Durable goods dropped again, this month -1.7%. Auto products are to blame with a -2.9% monthly drop. Below is the graph since 1980 and durable manufacturing seems to closely follow overall recessions.
Below is graph of industrial production showing the percent change from a year ago. Here too we see declining percentage slopes aligning to recessionary periods, the gray bars in the graph.

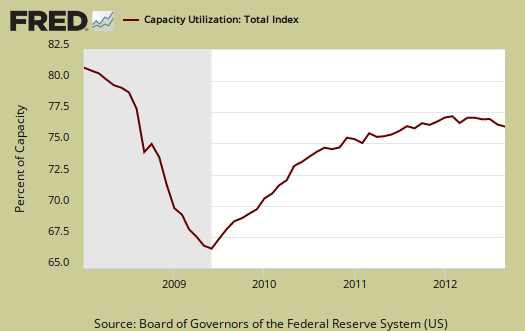
Capacity utilization, or of raw capacity, how much is being used, for total industry is 78.3%, now 2.0 percentage points below the average from 1972 to 2011, 80.3%. Capacity utilization has increased 1.1 percentage points from a year ago. Manufacturing capacity utilization has increased 1.3 percentage points from a year ago to 76.8%. Utility capacity utilization has decreased -2.8 percentage points from a year ago to 74.8%. Mining has increased 1.6 percentage points, to a 89.1% from a year ago.
Capacity utilization is how much can we make vs. how much are we currently using, of what capacity is available now. Capacity utilization is industrial production divided by raw capacity.
Capacity growth is raw capacity and not to be confused what what is being utilized. Instead, this is the actual growth or potential to produce. Capacity is the overall level of plants, production facilities, and ability to make stuff, that we currently have in the United States. Think about a new factory being built, or a factory shut down and it's machinery sold at auction and shipped to China. This is capacity. Capacity growth overall has increased only 1.4 percentage points from September 2011. Below is the capacity growth increase from a year ago of the subcategories which make up industrial production.
- Manufacturing: +1.4%
- Mining: +2.0%
- Utilities: +2.3%
According to the report for 2011, manufacturing uses 77.0% of capacity, with durables and nondurables each about 51.6% of that. Utilities use 10.3% and mining 12.8% in 2011 (rounded) to give a ratio of manufacturing vs. mining and utilities in terms of capacity. Selected high tech industries holds a measly 3.45% of the industrial portion and with computers only 0.44% and communications equipment only 0.66%.
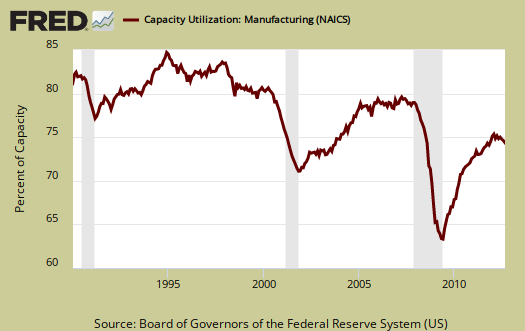
Below is the Manufacturing capacity utilization graph, normalized to 2007 raw capacity levels, going back to the 1990's. Too often the focus is on the monthly percent change, so it's important to compare capacity utilization to pre-recession levels and also when the economy was more humming.
The Federal Reserve releases detailed tables for more data, metrics not mentioned in this overview.
If you are baffled by what crude, finished mean from the G.17 report, read these stages of production definitions. Stages of production have implications for exports and imports. Finishing industrial production implies goods for final sale and thus what kind of output one will see for the month.
Here is our overview from last month, only graphs revised.
Recent comments