
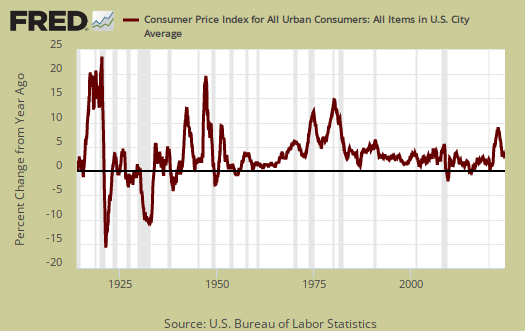
The Consumer Price Index showed a September 0.3% increase. The culprits were shelter, which soared up 0.4% for the month and gasoline, which rose 5.8% for the month. Food inflation had no change. Inflation with food and energy price changes removed increased 0.1% as shelter and medical costs are part of core inflation. From a year ago overall CPI has now risen 1.5%, the highest annual increase in 23 months. Without energy and food considered, prices have increased 2.2% for the year. CPI measures inflation, or price increases.

Yearly overall inflation is shown in the below graph and we can see the 1.5% uptick.
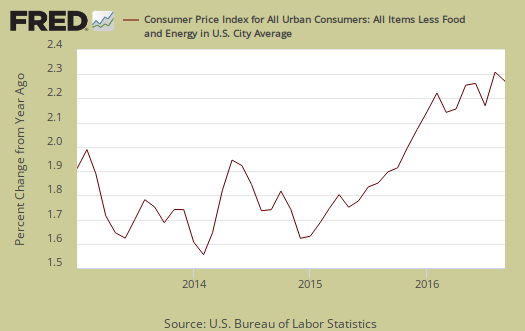
Core inflation, or CPI with all food and energy items removed from the index, has increased 2.2% for the last year. For the past decade the annualized inflation rate has been 1.9%. Core inflation is the figure the Federal Reserve considers for interest rate increase decisions.
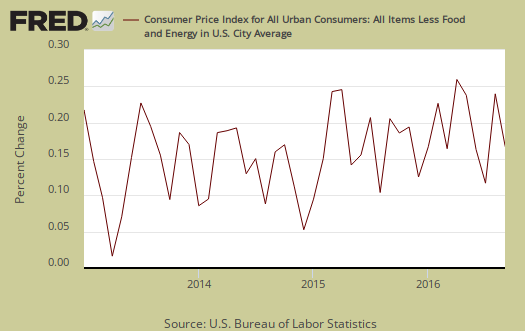
Core CPI's monthly percentage change is graphed below. This month core inflation increased 0.1%. Within core inflation, shelter increased 0.4%, with monthly rental costs increasing 0.3% and home ownership increased 0.4%. Shelter overall is up 3.4% for the year with rent increasing 3.7% annually. Car insurance increased 0.4% and has been rising, now 6.4% for the year. Apparel declined by -0.7% and is down -0.1% for the year.
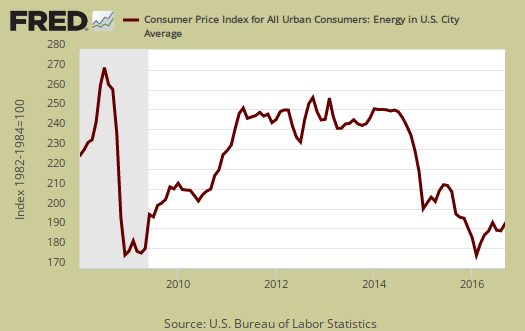
The energy index is down only -2.9% from a year ago. The BLS separates out all energy costs and puts them together into one index. For the year, gasoline has declined -6.4%,as has fuel oil. Graphed below is the overall CPI energy index.
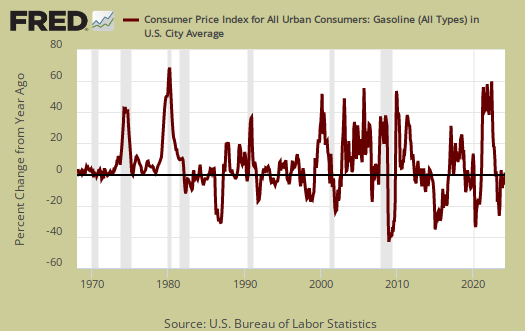
Graphed below is the CPI gasoline index and for the month gasoline prices increased 5.8%.
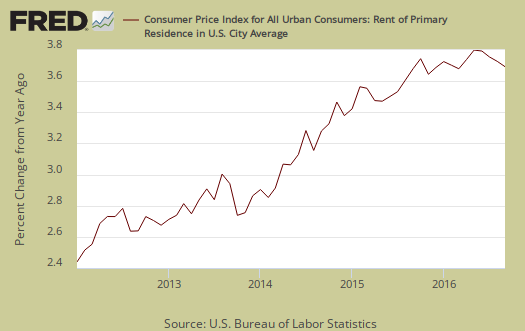
Graphed below is the rent price index which has been soaring for some time and is up 3.7% for the year.
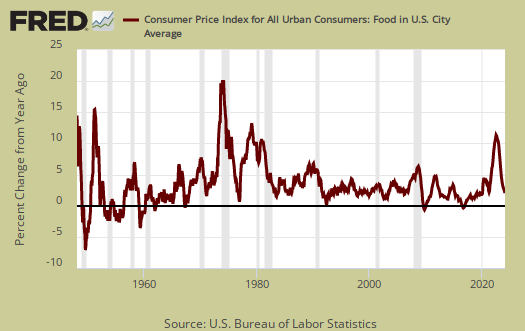
Food prices had no change for the month. Food and beverages have now decreased by -0.3% from a year ago. Groceries, (called food at home by the BLS), slid -0.1% for the month, and are down -2.2% for the year. Rice fell by -2.4%. for the month. Meats dropped by -0.7%. Dairy increased 0.1% for the month. Eating out, or food away from home increased 0.2% for the month and is up 2.4% for the year.
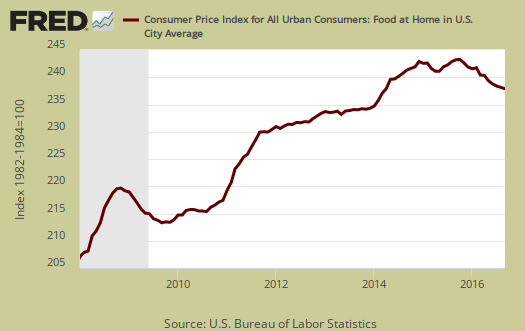
Graphed below are grocery prices, otherwise known as the food at home index.
The Medical care index rose 0.2% and this is the smallest monthly increase since March. Prescription drugs increased 0.8% while hospital services prices did not change. . Graphed below is the overall medical care index, which increased 0.5% for the month and is up 4.9% from a year ago.

Below is a graph of the medical commodities index, which is mostly prescription drug prices.

Real hourly earnings decreased by -0.1% for all employees. Real means wages adjusted for inflation. CPI increased 0.3% while wages only increased by 0.2% For the year real hourly earnings have increased 1.0%, which isn't that much of an improvement. The average real hourly wage is now $10.70 and the average wage, not adjusted for inlfation is $25.79 Weekly real earnings increased 0.2% as hours rose a tenth of a percentage point. Real weekly earnings now stand at $369.12. Average weekly hours increased 0.3% and weekly wages increased 0.5%. The work week is now 34.4 hours. There is a separate category for production and nonsupervisory employees and their real hourly earnings decreased by -0.1% to $9.23 and their real weekly earnings also decreased -0.1% to $309.07.
CPI details
The DOL/BLS does take yearly surveys on where the money goes in the monthly budget, but as one can see, food and energy are significant amounts of the monthly finances. Run away costs in these two areas can break the bank, so can food. Additionally CPI uses substitution, so if flour goes through the roof, somehow we're all just fine with oats and prices didn't really overall increase much. Here is the BLS CPI site, where one can find much more details, information on calculation methods and error margins.
Other CPI report overviews, unrevised, although most graphs are updated, are here. If you're wondering why the graphs display different figures from the text, the graphs calculate percentages from the index and do not round. The actual data from the BLS report does round to one decimal place. In other words, 0.05% is rounded to 0.1%.
3rd quarter retail sales adds about 67 basis points to GDP
with this CPI release for September, we can now attempt to estimate the economic impact of the September retail sales figures which were released last week, which saw nominal sales rise 0.6%...for the most accurate estimate, and the way the BEA will be figuring 3rd quarter GDP at the end of October, we would have to take each type of retail sales and adjust it with the appropriate change in price to determine real sales; for instance, September's clothing store sales, which were unchanged in dollars, should be adjusted with the price index for apparel, which indicated prices for clothing were down by 0.7%, which tells us that real retail sales of clothing were actually up by 0.7% September..then, to get a GDP relevant quarterly change, we'd have to compare such adjusted real clothing sales for July, August and September with the similarly adjusted real clothing consumption for the 3 months of the second quarter (April, May and June ), and then repeat that process for each other type of retailer, obviously quite a tedious task to undertake manually. The short cut we usually take to get a quick and dirty estimate of the change in real sales for the month is to apply the composite price index of all commodities less food and energy commodities, which was down 0.1%, to retail sales less grocery, gas station, and restaurant sales, which accounts for nearly 70% of aggregate retail sales. in dollars, those sales were up by roughly 0.5% in September, while their composite price index was down 0.1%, meaning that real retail sales excluding food and energy sales were up by around 0.6%. then, for the rest of the retail aggregate, we find sales at food and beverage stores were up 0.1% in September, while prices for food at home were down 0.1%, suggesting a real increase of around 0.2% in the quantity of food & beverages purchased for the month. Next, sales at bars and restaurants were up 0.8% in dollars, but those dollars also bought 0.2% less, so real sales at bars and restaurants were up by about 0.6%. And while gas station sales were up 2.4%, gasoline prices were up 5.8%, suggesting a substantial real decrease in the amount of gasoline sold, with the caveat that gas stations sell more than gasoline, and we don't have a detailed breakout on that. Weighing the food and energy components at roughly 30% of total retail sales, and core sales at 70%, we can estimate that the aggregate of real retail sales in September were up about 0.5% from those of August…
next, to see how the change in real September sales impacts the change in 3rd quarter GDP, we have to compare those September sales to those of the 2nd quarter...now, to get an approximation of the real adjusted changes for September vis a vis the 3 months of the first quarter, we'd normally also have to adjust the September percentage changes for the upward revision to July and August sales that were included in the September retail report, which saw July sales revised from $457.7 billion to $458.5 billion and August's sales revised from $456.3 billion to almost $457.0 billion...however, since the net August revision is considerably less than 0.1%, it will not affect our September percentage increase, but the total $1.5 billion extra sales would still add 0.03 percentage points to GDP...next, using Table 7 in the pdf for the August personal income and outlays report, which gives us already inflation adjusted changes for the prior months, we find that real sales of goods were up 0.2% in May, up 0.4% in June, up 0.7% in July, and down 0.6% in August...that means real September sales, up 0.5% from August, were up about 0.6% from June, up about 1.0% from May, and up about 1.2% from April, or up more than 0.9% from the average of the 2nd quarter...aggregating real September goods sales as 100.5% of those in August shown in Table 7 of the income and outlays report with July and August sales and comparing that to real 2nd quarter goods sales shown in Table 8, we find that real good sales grew 0.78 from the 2nd quarter to the 3rd, or at a 3.17% annual rate, a pace that would add at approximately .67 (+/-10%) percentage points to 3rd quarter GDP from the goods portion of personal consumption expenditures alone.. ...
rjs
did you check with the actual report
I'm not sure how you are breaking up the real goods stacked up in GDP.
yep, hit it on the nose, with one caveat
using full pdf: http://www.bea.gov/newsreleases/national/gdp/2016/pdf/gdp3q16_adv.pdf
aggregate PCE goods, table 2 line 3, added 48 basis points to GDP
but i also figured bar and restaurant sales, "Food services and accommodations" line 20 under services, which added another 14 basis points...
the caveat i noted above was i could not reconcile gas station sales up 2.4% with gasoline prices up 5.8%, which would imply a 3.4% decrease in gasoline sales. since that didn't make sense, i considered gasoline sales to be unchanged in my calculation.
turns out PCE for gasoline and other energy goods was down at a 3.5% rate and had subtracted 5 basis points from GDP (table 2, line 12, table 3, line 12)
so if i had included that, i would have estimated retail to have contributed .62 percentage points to 3rd quarter GDP, exactly what PCE goods + food services shows
however, even i can't be that accurate; since i'm only provided one significant digit in the CPI source data, the accuracy of my estimate can only be to one significant digit, hence my (+/-10%) margin of error
rjs