
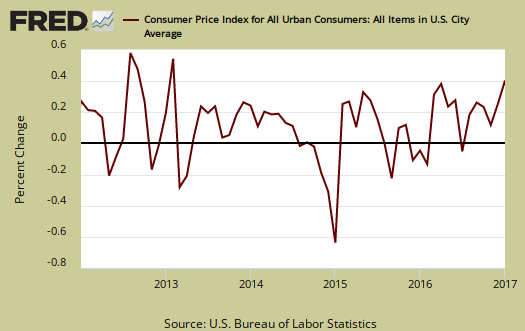
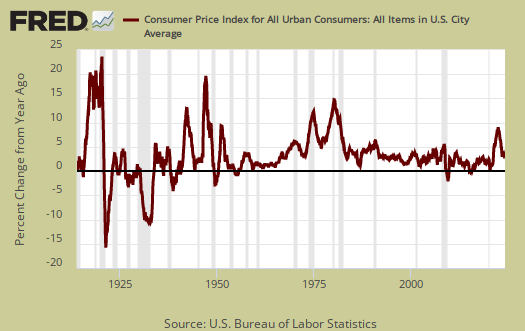
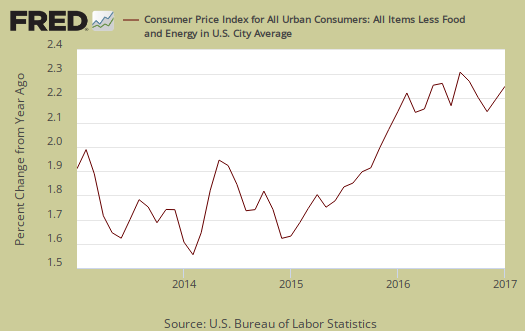
The Consumer Price Index for January really blew up. The monthly change was a whopping 0.6%, the largest monthly gain since February 2013. The main cause was gasoline, which jumped up 7.8% for the month. Inflation with food and energy price changes removed increased 0.3% as most costs increased. From a year ago overall CPI has now risen 2.5%, the highest annual increase since March 2012. Without energy and food considered, prices have increased 2.3% for the year, the largest increase since November 2011. CPI measures inflation, or price increases.
Yearly overall inflation is shown in the below graph and we can see the 2.5% increase and how much higher this is in comparison to other annual gains.
Core inflation, or CPI with all food and energy items removed from the index, has increased 2.3% for the last year, which is quite a jump. For the past decade the annualized inflation rate has been 1.9%. Core inflation is the figure the Federal Reserve considers for interest rate increase decisions and no surprise this is why they raised rates and probably will again based on these figures.
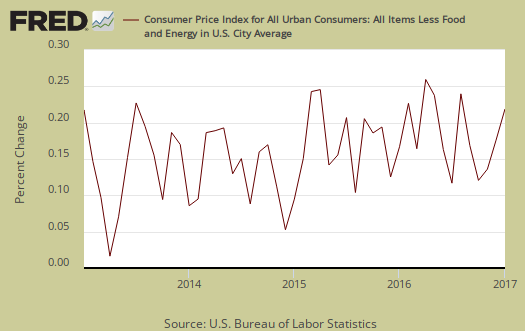
Core CPI's monthly 0.3% percentage change is graphed below. Within core inflation, shelter increased 0.2%, with monthly rental costs increasing 0.3% and home ownership equivalent rent increased 0.2%. Shelter overall is up 3.5% for the year with rent increasing 3.9% annually. Apparel increased 1.4% and new cars increased 0.9%, the largest jump since November 2009. Transportation increased 0.6%. Car insurance increased 0.8% and has been rising, now 7.5% for the year. Used cars and trucks declined by -0.4%, and are down annually by -3.7%. Airfares increased 2.0% and are down by -3.3% for the year.
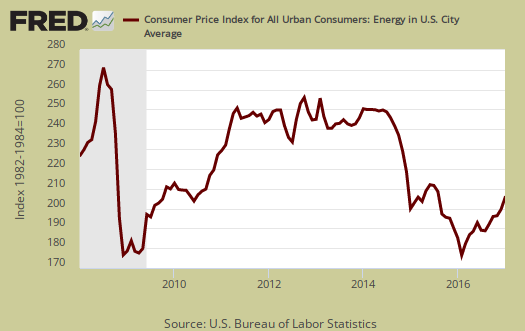
The energy index increased 4.0% for the month and is now up 10.8% from a year ago. The BLS separates out all energy costs and puts them together into one index. For the year, gasoline has now increased 7.8%. Fuel oil blew up 3.5% and has risen 24.8% for the year, That hurts. Graphed below is the overall CPI energy index.
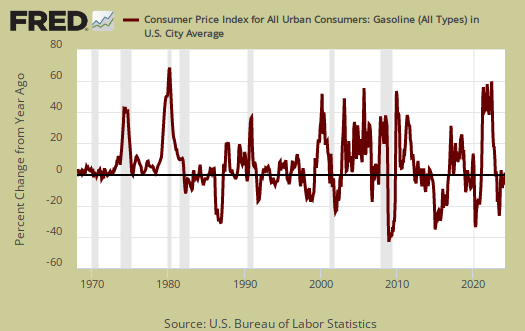
Graphed below is the CPI gasoline index annual percentage 7.8% change and for the month.
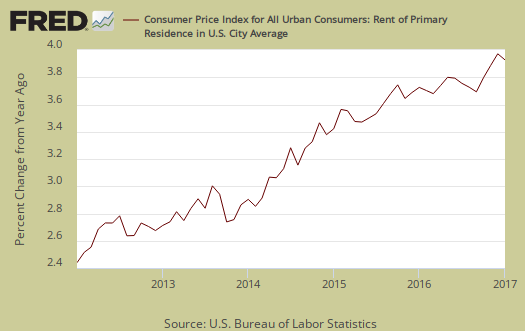
Graphed below is the rent price index which has been soaring for some time, now up 3.9% annually, and is shown in the below graph.
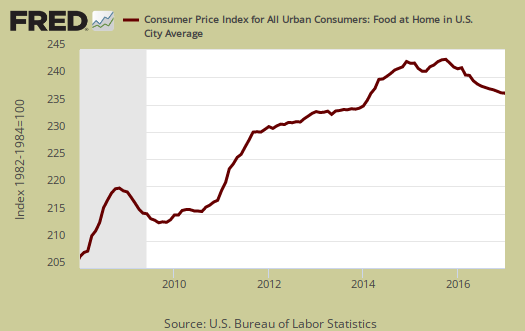
Food prices increased by 0.1% for the month. Food and beverages have now decreased by -0.2% from a year ago. Groceries, (called food at home by the BLS), had no change for the month, and are down -1.9% for the year. Dairy and related products increased 0.8% for the month, the largest gain since May 2014. That's not a big deal since Dairy but has declined 0.8% annually. Meat increased by 0.7% and are down -3.6% for the year. Fruits and vegetables nose dived by -1.7% for the month and are down by -4.9% for the year. Eating out, or food away from home increased 0.4% for the month and is up 2.4% for the year.
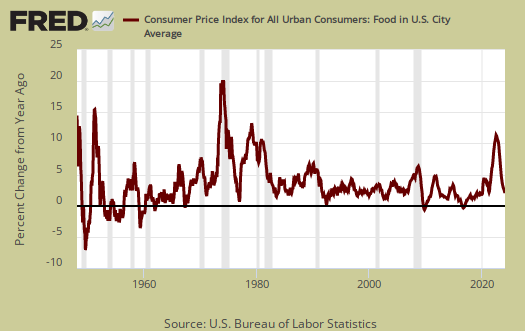
Graphed below are grocery prices, also referred to as the food at home index.
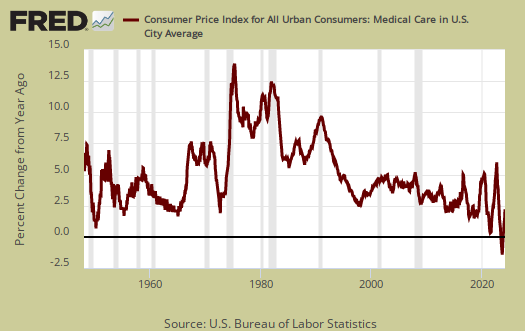
Medical costs are part of core inflation and are a never ending source of price increases. The Medical care index increased 0.2% for the month. Prescription drugs increased by 0.3% as did hospital services. Graphed below is the overall medical care index, which is up 3.9% from a year ago.
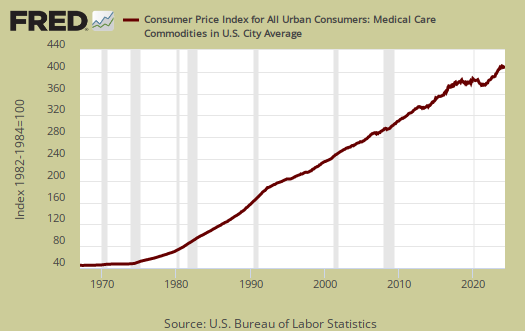
Below is a graph of the medical commodities index, which is mostly prescription drug prices and is up 0.3% for the month, 4.7% for the year.
Real hourly earnings decreased by -0.5% for all employees. Real means wages adjusted for inflation. CPI increased 0.6% while wages increased by 0.1%. For the year real hourly earnings have had no change. The average real hourly wage is now $10.65 and the average wage, not adjusted for inflation is $26. Weekly real earnings declined by -0.4% as hours worked did not change and weekly earnings increased by 0.1%. Real weekly earnings now stand at $366.32. The work week is 34.4 hours. There is a separate category for production and nonsupervisory employees and their real hourly earnings decreased by -0.4% to $9.16 and their real weekly earnings also decreased -0.4% to $307.86.
CPI details
The DOL/BLS does take yearly surveys on where the money goes in the monthly budget, but as one can see, food and energy are significant amounts of the monthly finances. Run away costs in these two areas can break the bank, so can food. Additionally CPI uses substitution, so if flour goes through the roof, somehow we're all just fine with oats and prices didn't really overall increase much. Here is the BLS CPI site, where one can find much more details, information on calculation methods and error margins.
Other CPI report overviews, unrevised, although most graphs are updated, are here. If you're wondering why the graphs display different figures from the text, the graphs calculate percentages from the index and do not round. The actual data from the BLS report does round to one decimal place. In other words, 0.05% is rounded to 0.1%.
Recent comments