
The June ISM Manufacturing Survey shows PMI recovered from last month's contraction by 1.9 percentage points to 50.9%. Manufacturing has moved into growth, but barely. Most of the major sub-indexes switched to growth except employment, which lags new orders and production. This is the first time manufacturing employment has shrunk since September 2009, not a welcome sign.

Comments from manufacturing survey responders said business is picking up, yet weak. The comment which stood out was from Chemical Products as the ring of truth for the economy in general.
Slow growth continues to choke the recovery. We are not out of the woods yet by any stretch of the imagination
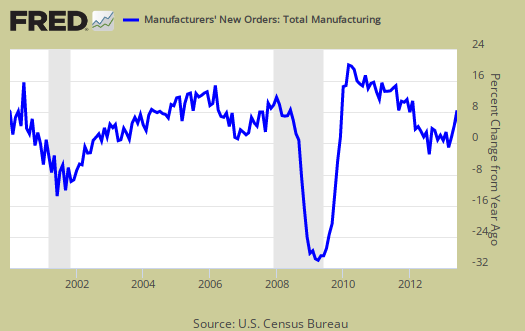
New Orders increased a 3.1 percentage point increase to 51.9%. Notice this is below the correlation with the Census Bureau.
A New Orders Index above 52.3 percent, over time, is generally consistent with an increase in the Census Bureau's series on manufacturing orders.
ISM gives an ordered list of manufacturing groups who show growth to decline in new orders:
The 11 industries reporting growth in new orders in June — listed in order — are: Apparel, Leather & Allied Products; Paper Products; Furniture & Related Products; Primary Metals; Food, Beverage & Tobacco Products; Petroleum & Coal Products; Plastics & Rubber Products; Machinery; Electrical Equipment, Appliances & Components; Fabricated Metal Products; and Miscellaneous Manufacturing. The five industries reporting a decrease in new orders during June are: Wood Products; Transportation Equipment; Chemical Products; Computer & Electronic Products; and Nonmetallic Mineral Products.

The Census reported manufactured May durable goods new orders growth was 3.6%, where factory orders, or all of manufacturing data, will be out later this month, but note the one month lag from the ISM survey. The ISM claims the Census and their survey are consistent with each other. Below is a graph of manufacturing new orders percent change from one year ago (blue, scale on right), against ISM's manufacturing new orders index (maroon, scale on left) to the last release data available for the Census manufacturing statistics. Here we do see a consistent pattern between the two.
Below is the ISM table data, reprinted, for a quick view.
| ISM Manufacturing June 2013 | ||||||
|---|---|---|---|---|---|---|
| Index | May 2013 | June 2013 | % Change. | Direction | Rate of Change | Trend Months |
| PMI™ | 49.0 | 50.9 | +1.9 | Growing | From Contracting | 1 |
| New Orders | 48.8 | 51.9 | +3.1 | Growing | From Contracting | 1 |
| Production | 48.6 | 53.4 | +4.8 | Growing | From Contracting | 1 |
| Employment | 50.1 | 48.7 | -1.4 | Contracting | From Growing | 1 |
| Supplier Deliveries | 48.7 | 50.0 | +1.3 | Unchanged | From Faster | 1 |
| Inventories | 49.0 | 50.5 | +1.5 | Growing | From Contracting | 1 |
| Customers' Inventories | 46.0 | 45.0 | -1.0 | Too Low | Faster | 19 |
| Prices | 49.5 | 52.5 | +3.0 | Increasing | From Decreasing | 1 |
| Backlog of Orders | 48.0 | 46.5 | -1.5 | Contracting | Faster | 2 |
| Exports | 51.0 | 54.5 | +3.5 | Growing | Faster | 7 |
| Imports | 54.5 | 56.0 | +1.5 | Growing | Faster | 5 |
| OVERALL ECONOMY | Growing | Faster | 49 | |||
| Manufacturing Sector | Growing | From Contracting | 1 | |||
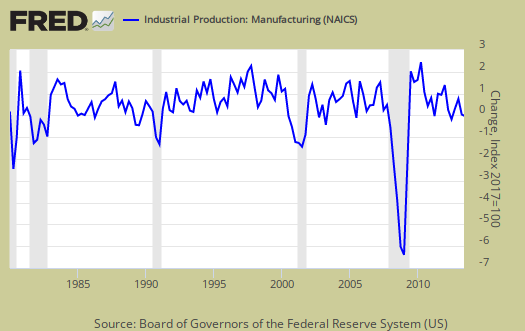
Production, which is the current we're makin' stuff now meter,increased 4.8 percentage points from last month to 53.4%, which is ia bounce back to growth. Production usually follows incoming orders in the next month, so this is a welcome surprise.

ISM's manufacturing production index loosely correlates to the Federal Reserve's industrial production, but not at 50% as the inflection point, instead 51.2% to indicate growth. Below is a graph of the ISM manufacturing production index (left, maroon), centered around the inflection point, quarterly average, against the Fed's manufacturing industrial production index's quarterly change (scale right, blue). We can see there is a matching pattern to the two different reports on manufacturing production.
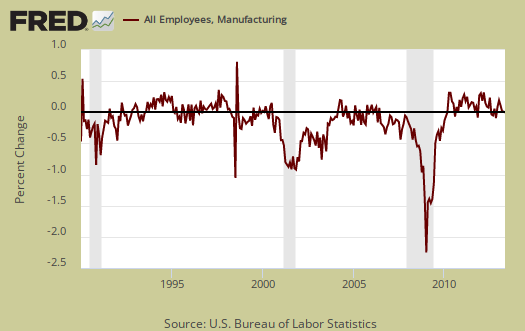
The manufacturing ISM employment index shed -1.4 percentage points to 48.7%, which is contraction. The neutral point for hiring vs. firing is 50.1%. Employment lags new orders and production, so we expected employment to contract. Below are the BLS manufacturing non-farm payrolls (jobs) for the past decade on the left (maroon), graphed against the ISM manufacturing employment index on the right (blue). The BLS manufacturing payrolls is the monthly percentage change and the ISM manufacturing employment index is centered around it's inflection point of contraction and employment growth. This is just monthly change, manufacturing has lost approximately 6 million jobs over the graphed time period.
Inventories showed a bounced back with growth after three months of contraction. May saw inventories gain 1.5 percentage points to 51.5%. As the economy is stagnant, businesses adjust inventories in response, which in turn impacts GDP. In December 2009 inventories came in at 41.9% for comparison's sake. Changes in nonfarm inventories, of which manufacturing is only a part, only subtracted -0,26 percentage points from Q1 2013's 1.8% GDP.
An Inventories Index greater than 42.7 percent, over time, is generally consistent with expansion in the Bureau of Economic Analysis' (BEA) figures on overall manufacturing inventories.

Supplier deliveries are how fast manufacturers can get their supplies. A value higher than 50 indicates slower delivery times, a value below 50 means the supply chain is speeding up. The index increased 1.3 percentage points to 50.0%, which means no change in speed.

Order backlogs dropped another -1.5 percentage points to 46.5% and is in contraction. Backlogs of orders contraction is not good news. Less order backlogs would imply less production and eventually employment will be stepped down.

Imports increased 1.5 percent points to 56.0% and and are in expansion or no change for the 7th month in a row. Imports are materials from other countries manufacturers use to make their products.

New orders destined for export, or for customers outside of the United States bounced back by 3.5 percentage point to 51% and is in expansion for the 7th month in a row.

Prices increased 3.0 percentage points to 52.5% which shows raw materials prices increased again after last month's decline..

Customer's inventories decreased -1.0 percentage points to 45%. Below 50 means customer's inventories are considered by manufacturers to be too low. Customer inventories, not to be confused with manufacturer's inventories, are how much customers have on hand, and rates the level of inventories the organization's customers have.

Here is the ISM industrial sector ordered list of growth and contraction. Chemical products reported contraction for the last three months.
Of the 18 manufacturing industries, 12 are reporting growth in June in the following order: Furniture & Related Products; Apparel, Leather & Allied Products; Paper Products; Electrical Equipment, Appliances & Components; Petroleum & Coal Products; Wood Products; Food, Beverage & Tobacco Products; Primary Metals; Fabricated Metal Products; Plastics & Rubber Products; Machinery; and Nonmetallic Mineral Products. The four industries reporting contraction in June are: Textile Mills; Transportation Equipment; Chemical Products; and Computer & Electronic Products.
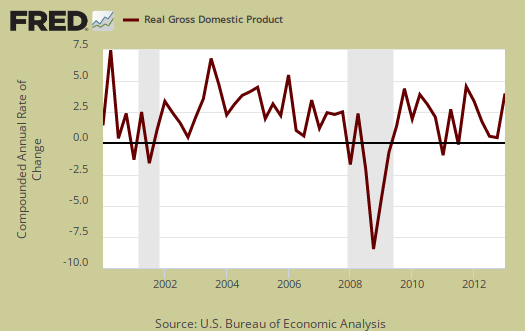
The ISM has a correlation formula to annualized real GDP, but they are now noting the past correlation, but note, PMI only has to be above 42.2% to indicate economic growth (right). Notice also that the PMI went to equal weighting in 2008. June's data, gives a 2.7% 2013 annual real GDP correlation. The below graph plots real GDP, left scale, against PMI, right scale, GDP up to Q1 2013. One needs to look at the pattern of the two lines to get anything out of this by quarters graph. If they match, GDP goes up, PMI goes up, would imply some correlation. Of all of the ISM's correlations, this is the one which consistently is way off.
The ISM neutral point is 50, generally. Above is growth, below is contraction, There is some some variance in the individual indexes and their actual inflection points. For example, A manufacturing PMI above 42, over time, also indicates growth, even while manufacturing is in the dumpster. Here is last month's manufacturing ISM overview, unrevised. The ISM has much more data, tables, graphs and analysis on their website. For more graphs like the above, see St. Louis Federal Reserve Fred database and graphing system. PMI™ stands for purchasing manager's index. On ISM correlations to other indexes, when in dollars they normalized to 2000 values. The above graphs do not do that, so our graphs are much more rough than what the ISM reports these indices track.
Note: The ISM is seasonally adjusting some of these indexes and not others due to the criteria for seasonal adjustment. Those indexes not seasonally adjusted are: Inventories, Customers' Inventories, Prices, Backlog of Orders, New Export Orders and Imports.
Recent comments