
The February ISM Manufacturing Survey somewhat recovered from last month's plunge. PMI rose by 1.9 percentage points to 53.2%. This range is really mediocre growth for manufacturing. New orders did rebound with a 3.3 percentage point increase. Yet production just completely imploded, the second month in a row. Many blame the unusually bad weather and freezing cold. As is, this still is a very mediocre report, but looks good next to last month's disastrous one.

This is a direct survey of manufacturers and every month ISM publishes survey responders' comments. The actual survey comments were mainly about the weather.
New orders is now 54.5% and picked up from last month. This is range of the index implies moderate growth, nothing on fire with new orders.

The Census reported January durable goods new orders declined by -1.0%, where factory orders, or all of manufacturing data, will be out later this month, but note the one month lag from the ISM survey. The ISM claims the Census and their survey are consistent with each other and they are right. Below is a graph of manufacturing new orders percent change from one year ago (blue, scale on right), against ISM's manufacturing new orders index (maroon, scale on left) to the last release data available for the Census manufacturing statistics. Here we do see a consistent pattern between the two and this is what the ISM says is the growth mark:
A New Orders Index above 52.3 percent, over time, is generally consistent with an increase in the Census Bureau's series on manufacturing orders.

Below is the ISM table data, reprinted, for a quick view.
| ISM Manufacturing Feburary 2014 | ||||||
|---|---|---|---|---|---|---|
| Index | January 2014 | February 2014 | % Change. | Direction | Rate of Change | Trend Months |
| PMI™ | 51.3 | 53.2 | +1.9 | Growing | Faster | 9 |
| New Orders | 51.2 | 54.5 | +3.3 | Growing | Faster | 9 |
| Production | 54.8 | 48.2 | -6.6 | Contracting | From Growing | 1 |
| Employment | 52.3 | 52.3 | 0.0 | Growing | Samer | 8 |
| Supplier Deliveries | 54.3 | 58.5 | +4.2 | Slowing | Faster | 9 |
| Inventories | 44.0 | 52.5 | +8.5 | Growing | From Contracting | 1 |
| Customers' Inventories | 44.0 | 46.5 | +2.5 | Too Low | Slower | 27 |
| Prices | 60.5 | 60.0 | -0.5 | Increasing | Slower | 7 |
| Backlog of Orders | 48.0 | 52.0 | +4.0 | Growing | From Contracting | 1 |
| Exports | 54.5 | 53.5 | -1.0 | Growing | Slower | 15 |
| Imports | 53.5 | 53.5 | 0.0 | Growing | Same | 13 |
| OVERALL ECONOMY | Growing | Faster | 57 | |||
| Manufacturing Sector | Growing | Faster | 9 | |||
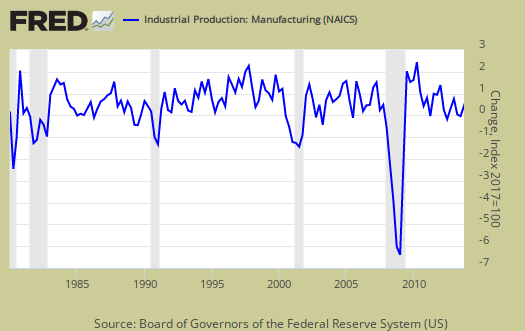
Production, which is the current we're makin' stuff now meter, plunged again by -6.6 percentage points and went into contraction. This is the lowest level of production since May 2009, so these results are simply terrible. Let's hope it is the weather for normally this kind of result would indicate really bad news for manufacturing. Production usually follows incoming orders in the next month.

ISM's manufacturing production index loosely correlates to the Federal Reserve's industrial production, but not at 50% as the inflection point, instead 51.2% to indicate growth. Below is a quarterly graph of the ISM manufacturing production index (left, maroon), centered around the inflection point, quarterly average, against the Fed's manufacturing industrial production index's quarterly change (scale right, blue). We can see there is a matching pattern to the two different reports on manufacturing production.
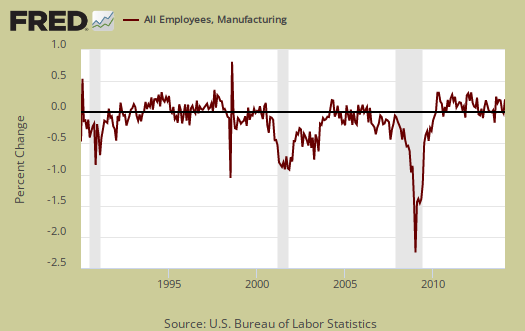
The manufacturing ISM employment index is now 52.3% and did not change at all from last month. This index really needs to be in the 60's to have real job creation. The neutral point for hiring vs. firing is 50.1%. While the employment index is at a two and a half year high, the reality is manufacturing jobs have just been hammered going all the way back to the 1990's. Below are the BLS manufacturing non-farm payrolls (jobs) for the past decade on the left (maroon), graphed against the ISM manufacturing employment index on the right (blue). The BLS manufacturing payrolls is the monthly percentage change and the ISM manufacturing employment index is centered around it's inflection point of contraction and employment growth. This is just monthly change, manufacturing has lost approximately six million jobs over the graphed time period.
The inventories index, which gives an estimate of how much raw materials manufacturers have on hand, went soaring up, an increase of 8.5 percentage points to 52.5%. This is the largest month over month change in inventories since April 1988. This is also better news for Q1 GDP, although it is much too early to see how all inventories will shake out.
An Inventories Index greater than 42.7 percent, over time, is generally consistent with expansion in the Bureau of Economic Analysis' (BEA) figures on overall manufacturing inventories.

Supplier deliveries are how fast manufacturers can get their supplies. A value higher than 50 indicates slower delivery times, a value below 50 means the supply chain is speeding up. The index increased by 4.2 percentage points to 58.5%, which means a slower speed and slower than the previous month, no surprise considering the dreaded never ending winter. You may wonder why slow deliveries would boost up PMI and indicate stronger growth in manufacturing. The reason is slower vendor performance means there is probably higher demand for that supply and thus indicates increasing activity. Seems really round about way to indicate economic growth, but there ya have it.

Order backlogs increased 4.2 percentage points to 5.2% which means they expanded. Less order backlogs would imply less production and less new employees to reduce backlogs, so this is a better sign.

Imports had no change from last month and are 53.5%. Imports are materials from other countries manufacturers use to make their products and high levels isn't too great for economies of scale in the U.S. We want to see U.S. manufacturers use other U.S. manufactured materials instead of imports as much as possible.

New orders destined for export, or for customers outside of the United States declined by -1.0 percentage point to 53.5% and has been in expansion for 15 months. While the decline isn't very good news, at least manufacturer's exports are still growing.

Prices remained high. Prices decreased by -0.5 percentage point to 60.0% which shows raw materials prices really remained about the same rate of increase as last month. Prices are yo-yo, up and down, but this is the 7th month in a row for price increases in materials used by manufacturers. The ISM gives an index correlation to BEA price increases of 49.7%.

Customer's inventories increased by 2.5 percentage points to 46.5%. Below 50 means customer's inventories are considered by manufacturers to be too low. Customer inventories, not to be confused with manufacturer's inventories, are how much customers have on hand, and rates the level of inventories the organization's customers have. This sub-index is kind of useless as it always reports customer's inventories are too low, although by how much can indicate inventory contractions and expansions.

Here is the ISM industrial sector ordered list of growth and contraction. Chemical products just is increasingly in contraction and one must wonder if they are being hammered by offshore production.
Of the 18 manufacturing industries, 14 are reporting growth in February in the following order: Textile Mills; Wood Products; Machinery; Printing & Related Support Activities; Plastics & Rubber Products; Nonmetallic Mineral Products; Transportation Equipment; Paper Products; Food, Beverage & Tobacco Products; Electrical Equipment, Appliances & Components; Fabricated Metal Products; Furniture & Related Products; Primary Metals; and Chemical Products. The three industries reporting contraction in February are: Apparel, Leather & Allied Products; Petroleum & Coal Products; and Miscellaneous Manufacturing.
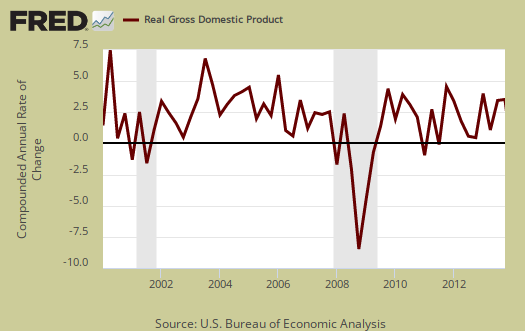
The ISM has a correlation formula to annualized real GDP, but they are now noting the past correlation, but note, PMI only has to be above 42.2% to indicate economic growth (right). Notice also that the PMI went to equal weighting in 2008. February alone gives a 3.3 % 2013 annual real GDP correlation. The below graph plots real GDP, left scale, against PMI, right scale, real GDP up to Q4 2013. One needs to look at the pattern of the two lines to get anything out of this by quarters graph. If they match, GDP goes up, PMI goes up, would imply some correlation. While ISM says there is a correlation, it might be in the long past, after multiple revisions to GDP has come to fruition.
The ISM manufacturing index is important due to the economic multiplier effect. While manufacturing is about an eighth of the economy, it is of scale and spawns all sorts of additional economic growth surrounding the sector.
The ISM neutral point is 50, generally. Above is growth, below is contraction, There is some some variance in the individual indexes and their actual inflection points. For example, A manufacturing PMI above 42, over time, also indicates growth, even while manufacturing is in the dumpster. Here are past manufacturing ISM overviews, unrevised. The ISM has much more data, tables, graphs and analysis on their website. For more graphs like the above, see St. Louis Federal Reserve Fred database and graphing system. PMI™ stands for purchasing manager's index. On ISM correlations to other indexes, when in dollars they normalized to 2000 values. The above graphs do not do that, so our graphs are much more rough than what the ISM reports these indices track.
Note: The ISM is seasonally adjusting some of these indexes and not others due to the criteria for seasonal adjustment. Those indexes not seasonally adjusted are: Inventories, Customers' Inventories, Prices, Backlog of Orders, New Export Orders and Imports.
BLS budget cuts
A press release from the US Bureau of Labor Statistics reports that, because its budget has been cut by $21 million (down to $592 million), it will cut back on the International Price Program and on the Quarterly Census of Employment and Wages.
http://conversableeconomist.blogspot.com/2014/02/death-of-statistic.html