
The December 2012 ISM Manufacturing Survey shows PMI increased by 1.2 percentage points to 50.7% and is now in expansion from contraction. This is the 3rd time in seven months manufacturing PMI has been in expansion. Overall the report is a bounce from last month's lows.

The best thing from this month's ISM report are the comments from manufacturing survey responders. One seemed thrilled the election was over, another mentioned the poetic forward economic visibility is foggy and Machinery manufacturers observed something interesting from their Chinese suppliers:
Many Chinese sources are coming to us with cost reductions to maintain their current business volumes.
New Orders had no change from last month's 50.3%. New Orders inflection point, where expansion turns into contraction, isn't exactly 50% for the long term, it is 52.3%. This implies while the monthly new orders is growing, the long term is not. From the ISM:
A New Orders Index above 52.3 percent, over time, is generally consistent with an increase in the Census Bureau's series on manufacturing orders.

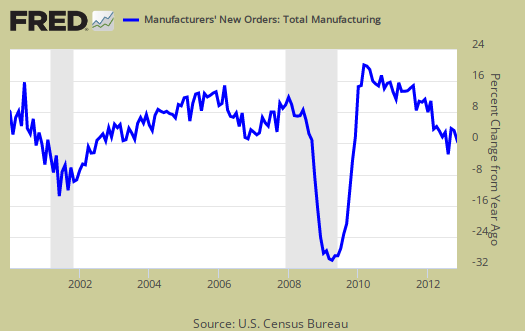
The Census reported manufactured durable goods new orders as low growth, 0.7% in November where factory orders, or all of manufacturing data, will be out January 4th. The ISM claims the Census and their survey are consistent with each other. To wit, below is a graph of manufacturing new orders percent change from one year ago (blue, scale on right), against ISM's manufacturing new orders index (maroon, scale on left) to the last release data available for the Census manufacturing statistics. Here we do see a consistent pattern between the two.
Below is the ISM table data, reprinted, for a quick view.
| Manufacturing at a Glance December 2012 | ||||||
|---|---|---|---|---|---|---|
| Index | Dec. | Nov. | % Point Chg. | Direction | Rate | Trend |
| PMI | 50.7 | 49.5 | +1.2 | Growing | From Contracting | 1 |
| New Orders | 50.3 | 50.3 | 0.0 | Growing | Same | 4 |
| Production | 52.6 | 53.7 | -1.1 | Growing | Slower | 3 |
| Employment | 52.7 | 48.4 | +4.3 | Growing | From Contracting | 1 |
| Supplier Deliveries | 54.7 | 50.3 | +4.4 | Slowing | Faster | 2 |
| Inventories | 43.0 | 45.0 | -2.0 | Contracting | Faster | 2 |
| Customers' Inventories | 47.0 | 42.5 | +4.5 | Too Low | Slower | 13 |
| Prices | 55.5 | 52.5 | +3.0 | Increasing | Faster | 5 |
| Backlog of Orders | 48.5 | 41.0 | +7.5 | Contracting | Slower | 9 |
| Exports | 51.5 | 47.0 | +4.5 | Growing | From Contracting | 1 |
| Imports | 51.5 | 48.0 | +3.5 | Growing | From Contracting | 1 |
| OVERALL ECONOMY | Growing | Faster | 43 | |||
| Manufacturing Sector | Growing | From Contracting | 1 | |||
Production, which is the current we're makin' stuff now meter, decreased -1.1 percentage points from last month to 52.6%, but is still in expansion. Production usually follows incoming orders so this is no surprise as reflected by November's new order plunge.

ISM's manufacturing production index loosely correlates to the Federal Reserve's industrial production, but not at 50% as the inflection point, instead 51.2% to indicate growth. Below is a graph of the ISM manufacturing production index (left, maroon), centered around the inflection point, quarterly average, against the Fed's manufacturing industrial production index's quarterly change (scale right, blue). We can see there is a matching pattern to the two different reports on manufacturing production.

The manufacturing ISM employment index came up 4.3 percentage points to 52.7% and moved into expansion. The neutral point for hiring vs. firing is 50.1% and November's contraction was the 1st time in 39 months. This is actually great news that employment is not in a contraction trend.
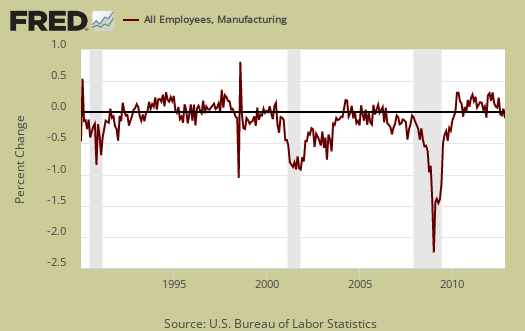
Below are the BLS manufacturing non-farm payrolls (jobs) for the past decade on the left (maroon), graphed against the ISM manufacturing employment index on the right (blue). The BLS manufacturing payrolls is the monthly percentage change and the ISM manufacturing employment index is centered around it's inflection point of contraction and employment growth. This is just monthly change, manufacturing has lost approximately 6 million jobs over the graphed time period.
Inventories dropped another -2.0 percentage points to 43.0%, which is is not a good sign and is in contraction. This is the lowest point since December 2009 when the inventories came in at 41.9%. The ISM claims inventories are correlated to manufacturing inputs, that are part of GDP. Changes in nonfarm inventories, of which manufacturing is only a part, added 1.16 percentage points to Q3 2012's 2.7% GDP.
An Inventories Index greater than 42.8 percent, over time, is generally consistent with expansion in the Bureau of Economic Analysis' (BEA) figures on overall manufacturing inventories.

Supplier deliveries are how fast manufacturers can get their supplies. A value higher than 50 indicates slower delivery times, a value below 50 means the supply chain is speeding up. The index increased 4.4 percentage points to 54.7% which means things are really sllooowww.

Backlog of orders really popped up, by 7.5 percentage points, to 48.5%. Order backlogs are still in contraction, now for nine consecutive months. More order backlogs would imply production and thus hiring might be stepped up, although the index is still in contraction, below 50%. Order backlogs are exactly what they sound like and only 86% of survey respondents reported on order backlogs.

Imports increased 3.5 percent points to 51.5% and moved into expansion after contracting since July 2012. Imports are materials from other countries manufacturers use to make their products. That China supply comment from survey respondents might be applicable here.

New orders destined for export, or for customers outside of the United States, increased 4.5 percentage point to 51.5% and is in expansion, the 1st month since May 2012.

The ISM price index increased 3.0 percentage points to 55.5%. Prices are what manufacturers pay to make their products and this month means prices are increasing, and at a faster rate. In April 2009 the price subindex was 32%.

Customer's inventories increased 4.5 percentage points to 47.0% after last month's plunge. Below 50 means customer's inventories are considered by manufacturers to be too low. Customer inventories, not to be confused with manufacturer's inventories, are how much customers have on hand, and rates the level of inventories the organization's customers have.

Here is the ISM industrial sector ordered list of growth and contraction. Printing may very well be subject to a technological shift.
Of the 18 manufacturing industries, seven are reporting growth in December in the following order: Furniture & Related Products; Paper Products; Petroleum & Coal Products; Wood Products; Primary Metals; Computer & Electronic Products; and Food, Beverage & Tobacco Products. The nine industries reporting contraction in December — listed in order — are: Nonmetallic Mineral Products; Chemical Products; Miscellaneous Manufacturing; Plastics & Rubber Products; Fabricated Metal Products; Transportation Equipment; Machinery; Electrical Equipment, Appliances & Components; and Apparel, Leather & Allied Products.
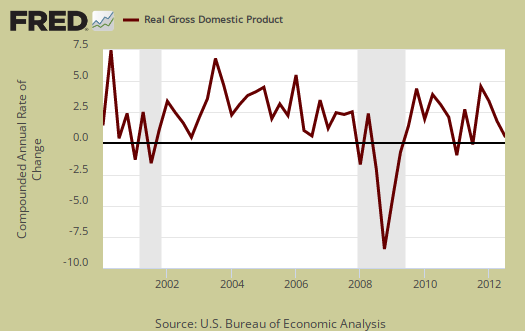
The ISM has a correlation formula to annualized real GDP, but they are now noting the past correlation. Notice also that the PMI went to equal weighting in 2008. December's data, the ISM get a 2.7% 2012 annual real GDP, this time right on the money for Q3 at least. The below graph plots real GDP, left scale, against PMI, right scale, GDP up to Q3 2012. One needs to look at the pattern of the two lines to get anything out of this by quarters graph. If they match, GDP goes up, PMI goes up, would imply some correlation. ISM claims the January to December PMI indicates a 3.1% annual real GDP.
The ISM neutral point is 50, generally. Above is growth, below is contraction, There is some some variance in the individual indexes and their actual inflection points. For example, A manufacturing PMI above 42, over time, also indicates growth, even while manufacturing is in the dumpster.
Here is last month's manufacturing ISM overview, unrevised.
The ISM has much more data, tables, graphs and analysis on their website. For more graphs like the above, see St. Louis Federal Reserve Fred database and graphing system.
PMI™ stands for purchasing manager's index.
On ISM correlations to other indexes, when in dollars they normalized to 2000 values. The above graphs do not do that, so our graphs are much more rough than what the ISM reports these indices track.
why thank you NC and FT
We have two major sites linking to our ISM manufacturing overview today. Thanks very much!
I want to tout my own horn and point to this overview on wages where the raw data is number crunched and graphed. Written over the holidays it has not been read and I personally think median wages from aggregate IRS data is most telling.