
The May ISM Manufacturing Survey shows a slight improvement from last month, yet nothing to write home about. The composite PMI increased by 0.7 percentage points to 53.5%. Manufacturing employment accelerated and order backlogs dropped. Prices for manufacturers didn't change for the month. Overall the report is a more steady as she goes versus suddenly manufacturing is on fire as reported by some in the press.

The ISM Manufacturing survey is a direct survey of manufacturers. Generally speaking indexes above 50% indicate growth and below indicate contraction. Every month ISM publishes survey responders' comments, which are part of their survey. Strong and steady are mentioned to describe demand. Manufacturers also complain of a strong dollar hurting their products
New orders barely changed with a 0.2 percentage point increase to 56.0%. This represents moderate growth in new orders.

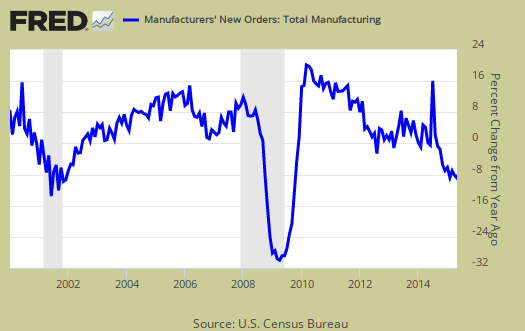
The Census reported May durable goods new orders increased 1.8%, where factory orders, or all of manufacturing data, will be out later this month. Note the Census one month lag from the ISM survey. The ISM claims the Census and their survey are consistent with each other and they are right. Below is a graph of manufacturing new orders percent change from one year ago (blue, scale on right), against ISM's manufacturing new orders index (maroon, scale on left) to the last release data available for the Census manufacturing statistics. Here we do see a consistent pattern between the two and this is what the ISM says is the growth mark:
A New Orders Index above 52.3 percent, over time, is generally consistent with an increase in the Census Bureau's series on manufacturing orders.
Below is the ISM table data, reprinted, for a quick view.
| ISM Manufacturing June 2015 | ||||||
|---|---|---|---|---|---|---|
| Index | May 2015 | June 2015 | % Change | Direction | Rate of Change | Trend Months |
| PMI™ | 52.8 | 53.5 | +0.7 | Growing | Faster | 30 |
| New Orders | 55.8 | 56.0 | +0.2 | Growing | Faster | 31 |
| Production | 54.5 | 54.0 | -0.5 | Growing | Slower | 34 |
| Employment | 51.7 | 55.5 | +3.8 | Growing | Faster | 2 |
| Supplier Deliveries | 50.7 | 48.8 | -1.9 | Faster | From Slowing | 1 |
| Inventories | 51.5 | 53.0 | +1.5 | Growing | Faster | 2 |
| Customers' Inventories | 45.5 | 48.5 | +3.0 | Too Low | Slower | 7 |
| Prices | 49.5 | 49.5 | 0.0 | Decreasing | Same | 8 |
| Backlog of Orders | 53.5 | 47.0 | -6.5 | Contracting | From Growing | 1 |
| Exports | 50.0 | 49.5 | -0.5 | Contracting | From Unchanged | 1 |
| Imports | 55.0 | 53.5 | -1.5 | Growing | Slower | 29 |
| OVERALL ECONOMY | Growing | Faster | 73 | |||
| Manufacturing Sector | Growing | Faster | 30 | |||
Production, which is the current we're makin' stuff now meter, decreased 0.5 percentage point increase to 54.0%. This is still moderate growth. Production usually follows incoming orders in the next month.

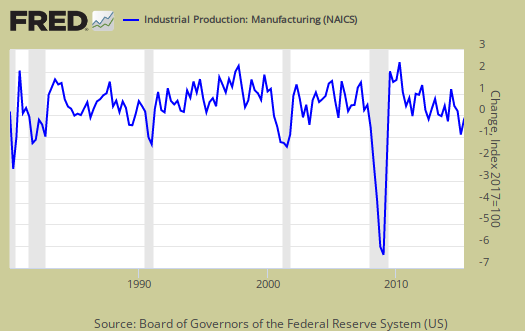
ISM's manufacturing production index loosely correlates to the Federal Reserve's industrial production, but not at 50% as the inflection point, instead 51.1% to indicate growth. Below is a quarterly graph of the ISM manufacturing production index (left, maroon), centered around the inflection point, quarterly average, against the Fed's manufacturing industrial production index's quarterly change (scale right, blue). We can see there is a matching pattern to the two different reports on manufacturing production.
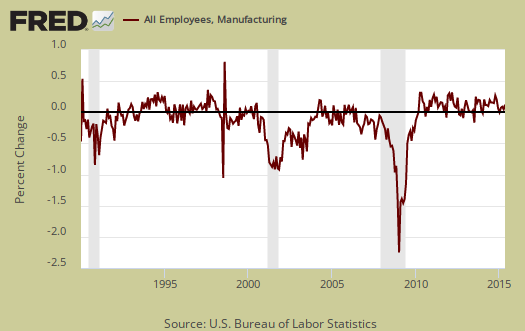
The manufacturing ISM employment index just came back up into hiring with a 3.8 percentage point bump to 55.5%. This index really needs to be in the 60's to have real job creation,but this is much better for manufacturing jobs regardless. The neutral point for hiring vs. firing is 50.6%. Generally speaking manufacturing jobs have just been hammered going all the way back to the 1990's. Below are the BLS manufacturing non-farm payrolls (jobs) for the past decade on the left (maroon), graphed against the ISM manufacturing employment index on the right (blue). The BLS manufacturing payrolls is the monthly percentage change and the ISM manufacturing employment index is centered around it's inflection point of contraction and employment growth.
The inventories index showed a +1.5 percentage point monthly increase to 53.0%. Inventories gives an estimate of how much raw materials manufacturers have on hand. Quoted below is the relationship between BEA and ISM inventories, not the 50% inflection point one would assume.
An Inventories Index greater than 42.9 percent, over time, is generally consistent with expansion in the Bureau of Economic Analysis' (BEA) figures on overall manufacturing inventories in chained 2000 dollars.

Supplier deliveries are how fast manufacturers can get their supplies. A value higher than 50 indicates slower delivery times, a value below 50 means the supply chain is speeding up. The index decreased -1.9 percentage points to 48.8%. You may wonder why slow deliveries would boost up PMI and indicate stronger growth in manufacturing. The reason is slower vendor performance means there is probably higher demand for that supply and thus indicates increasing activity.

Order backlogs contracted, dropping by -6.5 percentage points to 47.0%. More order backlogs would imply a need to ramp up even more production and (hopefully) more new employees to reduce them. This is a great sign.

Imports decreased by -1.5 percentage points to 53.5%. Imports are materials from other countries manufacturers use to make their products and high levels isn't too great for economies of scale in the U.S. We want to see U.S. manufacturers use other U.S. manufactured materials instead of imports as much as possible. More imports is really a negative sign for domestic economic growth, yet for manufacturers using cheap stuff to make other stuff, an increase is probably a good sign for the businesses at least.

New orders destined for export, or for customers outside of the United States is the one bad thing in this month's report. Exports went into contraction and stands at 49.5%. This could really imply a slow down in global demand.

Prices were the same as last month and stand at 49.5%, which is decreasing. The ISM gives an index correlation to BEA price increases of 52.1%.

Customer's inventories increased by 3.0 percentage points to 48.5%. Customer inventories, not to be confused with manufacturer's inventories, are how much customers have on hand, and rates the level of inventories the organization's customers have.

Generally speaking manufacturers were positive business is improving. Only oil & gas were negative and a weird one, Avian flu was impacting the egg supply. Here is the ISM industrial sector ordered list of growth and contraction. Notice there are only two industries in contraction.
Of the 18 manufacturing industries, 11 are reporting growth in June in the following order: Furniture & Related Products; Wood Products; Nonmetallic Mineral Products; Miscellaneous Manufacturing; Food, Beverage & Tobacco Products; Electrical Equipment, Appliances & Components; Transportation Equipment; Fabricated Metal Products; Chemical Products; Paper Products; and Computer & Electronic Products. The four industries reporting contraction in June are: Petroleum & Coal Products; Primary Metals; Plastics & Rubber Products; and Machinery..
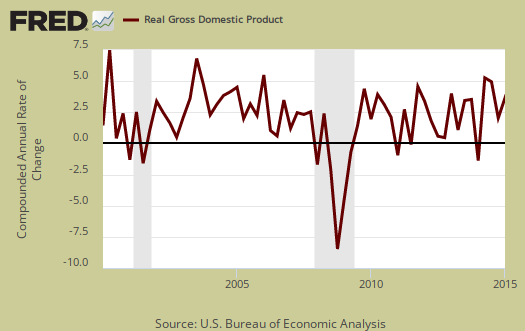
The ISM has a correlation formula to annualized real GDP, but they are now noting the past correlation, but note, PMI only has to be above 43.1% to indicate economic growth (right). June alone gives a 3.3% annual real GDP correlation, yet for the year, indicates a 3.0% increase. The below graph plots real GDP, left scale, against PMI, right scale, real GDP up to Q1 2015. One needs to look at the pattern of the two lines to get anything out of this by quarters graph. If they match, GDP goes up, PMI goes up, would imply some correlation.
The ISM manufacturing index is important due to the economic multiplier effect. While manufacturing is about an eighth of the economy, it is of scale and spawns all sorts of additional economic growth surrounding the sector.
PMI is a composite of equally weighted and seasonally adjusted New Orders, Production, Employment, Supplier Deliveries and Inventories.
The ISM neutral point is 50, generally. Above is growth, below is contraction, There is some some variance in the individual indexes and their actual inflection points as noted above. Here are past manufacturing ISM overviews, unrevised. The ISM has much more data, tables, graphs and analysis on their website. PMI™ stands for purchasing manager's index. On ISM correlations to other indexes, when in dollars they normalized to 2000 values. The above graphs do not do that, so our graphs are much more rough than what the ISM reports these indices track.
Note: The ISM is seasonally adjusting some of these indexes and not others due to the criteria for seasonal adjustment. Those indexes not seasonally adjusted are: Inventories, Customers' Inventories, Prices, Backlog of Orders, New Export Orders and Imports.
Recent comments