
The January 2016 ISM Manufacturing Survey is yet month of awful. Manufacturing is in a 4th month of contraction. This time is a smidgen better than December. PMI was 48.2%, 0.2 percentage points higher than the previous revised month. New orders did come out of contraction, but barely, while employment continued to plunge. Only eight sectors showed any growth according to the survey. A contracting manufacturing sector four months in a row is not a good sign and this survey is highly correlated to other economic metrics.

The ISM Manufacturing survey is a direct survey of manufacturers. Generally speaking, indexes above 50% indicate growth and below indicate contraction. Every month ISM publishes survey responders' comments, which are part of their survey. This month the comments were mixed and seemed to be more about technological disruptors for some fractions like computers and electronics. Low energy prices was a boon for some and a bust for producers. While some say low gas prices are hurting them, most talked about weak demand and cutting their inventories.
New orders increased by 2.7 percentage points to 51.5% and moved out of contraction. This is the best news in this month's survey.

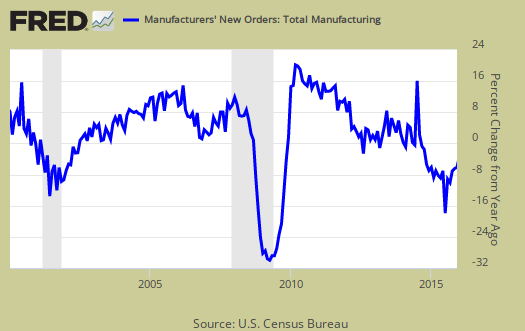
The Census reported December durable goods new orders plunged by -5.1%, where factory orders, or all of manufacturing data, will be out later this week. Note the Census one month behind the ISM survey. The ISM claims the Census and their survey are consistent with each other and they are right. Below is a graph of manufacturing new orders percent change from one year ago (blue, scale on right), against ISM's manufacturing new orders index (maroon, scale on left) to the last release data available for the Census manufacturing statistics. Here we do see a consistent pattern between the two and this is what the ISM says is the growth mark:
A New Orders Index above 52.3 percent, over time, is generally consistent with an increase in the Census Bureau's series on manufacturing orders.
Below is the ISM table data, reprinted, for a quick view.
| ISM Manufacturing January 2016 | ||||||
|---|---|---|---|---|---|---|
| Index | January 2016 | December 2015 | % Change | Direction | Rate of Change | Trend Months |
| PMI™ | 48.2 | 48.0 | +0.2 | Contracting | Slower | 4 |
| New Orders | 51.5 | 48.8 | +2.7 | Growing | From Contracting | 1 |
| Production | 50.2 | 49.9 | +0.3 | Growing | From Contracting | 1 |
| Employment | 45.9 | 48.0 | -2.1 | Contracting | Faster | 2 |
| Supplier Deliveries | 50.0 | 49.9 | +0.2 | Unchanged | From Faster | 1 |
| Inventories | 43.5 | 43.5 | 0.0 | Contracting | Same | 7 |
| Customers' Inventories | 51.5 | 51.5 | 0.0 | Too High | Same | 6 |
| Prices | 33.5 | 33.5 | 0.0 | Decreasing | Same | 15 |
| Backlog of Orders | 43.0 | 41.0 | +2.0 | Contracting | Slower | 8 |
| Exports | 47.0 | 51.0 | -4.0 | Contracting | From Growing | 1 |
| Imports | 51.0 | 45.5 | +5.5 | Growing | From Contracting | 1 |
| OVERALL ECONOMY | Growing | Faster | 80 | |||
| Manufacturing Sector | Contracting | Slower | 4 | |||
Production is the current, we're makin' stuff now meter and went from contraction to growth by simply increasing 0.3 percentage points from last month. Production usually follows incoming orders in the next month.

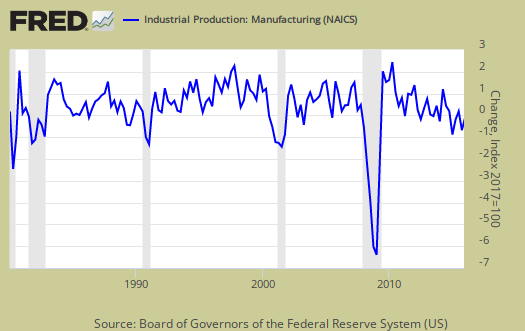
ISM's manufacturing production index loosely correlates to the Federal Reserve's industrial production, but not at 50% as the inflection point, instead 51.1% to indicate growth. Below is a quarterly graph of the ISM manufacturing production index (left, maroon), centered around the inflection point, quarterly average, against the Fed's manufacturing industrial production index's quarterly change (scale right, blue). We can see there is a matching pattern to the two different reports on manufacturing production.
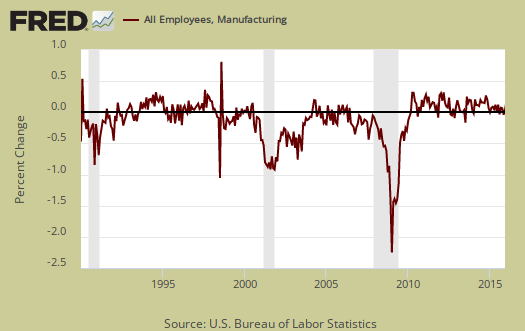
The manufacturing ISM employment index plunged by -3.2 percentage points to 48.1% and into contraction. The neutral point for hiring vs. firing is 50.6%, but at this point we'll take any growth. Below are the BLS manufacturing non-farm payrolls (jobs) for the past decade on the left (maroon), graphed against the ISM manufacturing employment index on the right (blue). The BLS manufacturing payrolls is the monthly percentage change and the ISM manufacturing employment index is centered around it's inflection point of contraction and employment growth.
The inventories index has been contracting for the 7th month in a row with and now with no change. Changes in inventories contributes to GDP and all inventories, not just manufacturing, subtracted off almost half a percentage point in Q4. Inventories gives an estimate of how much raw materials manufacturers have on hand and the contraction implies manufacturers expect a slow down to continue. Quoted below is the relationship between BEA and ISM inventories, not the 50% inflection point one would assume.
An Inventories Index greater than 42.9 percent, over time, is generally consistent with expansion in the Bureau of Economic Analysis' (BEA) figures on overall manufacturing inventories in chained 2000 dollars.

Supplier deliveries are how fast manufacturers can get their supplies. A value higher than 50 indicates slower delivery times, a value below 50 means the supply chain is speeding up. The index increased by 0.2 percentage points to 50.0% which is neutral. You may wonder why slow deliveries would boost up PMI and indicate stronger growth in manufacturing. The reason is slower vendor performance means there is probably higher demand for that supply and thus indicates increasing activity.

Order backlogs increased by 2.0 percentage points to 43.0%. Order backlogs have been in contraction for the last eight months which really isn't a good sign. Less order backlogs would imply there is no need to ramp up production to catch up.

Imports shot up by 5.5 percentage points to 51.0%. Imports are materials from other countries manufacturers use to make their products and high levels isn't too great for economies of scale in the U.S. We want to see U.S. manufacturers use other U.S. manufactured materials instead of imports as much as possible, yet because manufacturers offshore outsourced so much it is hard to discern which is a pick up and which is more lost jobs and production for U.S. suppliers.

New orders destined for export, or for customers outside of the United States plunged by -4.0 percentage points to 47.0% and into contraction. Manufacturing exports can also imply pick up and slow down in global demand.

Prices had no change and stayed at 33.5%, which is decreasing. Declining prices has been going on for 15 months now. The ISM gives an index correlation to BEA price increases of 52.1%.

Customer's inventories also had no change and stayed at 51.5%. Customer inventories, not to be confused with manufacturer's inventories, are how much customers have on hand, and rates the level of inventories the organization's customers have.

Here is the ISM industrial sector ordered list of growth and contraction. Note how many sectors are now shrinking.
Of the 18 manufacturing industries, eight are reporting growth in January in the following order: Textile Mills; Wood Products; Miscellaneous Manufacturing; Printing & Related Support Activities; Furniture & Related Products; Computer & Electronic Products; Machinery; and Electrical Equipment, Appliances & Components. The 10 industries reporting contraction in January — listed in order — are: Apparel, Leather & Allied Products; Nonmetallic Mineral Products; Petroleum & Coal Products; Paper Products; Transportation Equipment; Plastics & Rubber Products; Fabricated Metal Products; Food, Beverage & Tobacco Products; Primary Metals; and Chemical Products.
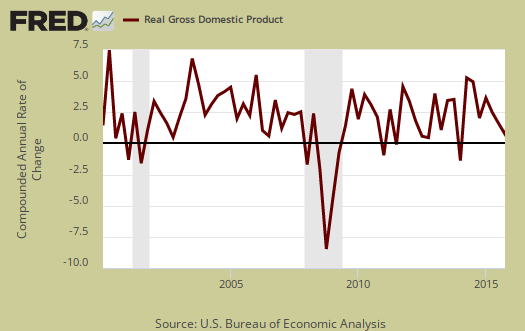
The ISM has a correlation formula to annualized real GDP. January alone gives a 1.6% annual real GDP correlation. The below graph plots real GDP, left scale, against PMI, right scale, real GDP up to Q4 2015. One needs to look at the pattern of the two lines to get anything out of this by quarters graph. If they match, GDP goes up, PMI goes up, would imply some correlation. Yet the estimate against itself is telling that a slowdown did occur at the end of the year.
The ISM manufacturing index is important due to the economic multiplier effect. People should really take note of this report and it appears Wall Street did from the slides and declines. U.S. manufacturing is about an eighth of the economy yet it is of scale and spawns all sorts of additional economic growth surrounding the sector.
PMI is a composite of equally weighted and seasonally adjusted New Orders, Production, Employment, Supplier Deliveries and Inventories.
The ISM neutral point is 50, generally. Above is growth, below is contraction, There is some some variance in the individual indexes and their actual inflection points as noted above. Here are past manufacturing ISM overviews, unrevised. The ISM has much more data, tables, graphs and analysis on their website. PMI™ stands for purchasing manager's index. On ISM correlations to other indexes, when in dollars they normalized to 2000 values. The above graphs do not do that, so our graphs are much more rough than what the ISM reports these indices track.
Note: The ISM is seasonally adjusting some of these indexes and not others due to the criteria for seasonal adjustment. Those indexes not seasonally adjusted are: Inventories, Customers' Inventories, Prices, Backlog of Orders, New Export Orders and Imports.
Recent comments