
If the US can’t constrain its own central bank from ruining the nation and the global economy, it will be up to the financial markets to punish the US in order to put a stop to the madness.
By definition, an unhealthy financial market is one in which prices move daily in one direction only, for an extended period of time. Markets without corrections, without the give and take of investors having different opinions about the future, are prone to sudden shocks. This is precisely the situation that has afflicted US stock markets since last July, when investors began to entertain the unanimous opinion that the stock market can only go up because the Federal Reserve will never allow it to correct. And why shouldn’t they think this way, when Fed Chairman Ben Bernanke keeps repeating that a rising stock market with low volatility is a monetary objective of the central bank? He said so again yesterday during his speech and follow-up press conference at the National Press Club:
... the Federal Reserve's securities purchases have been effective at easing financial conditions...equity prices have risen significantly, volatility in the equity market has fallen, corporate bond spreads have narrowed, and inflation compensation as measured in the market for inflation-indexed securities has risen from low to more normal levels...
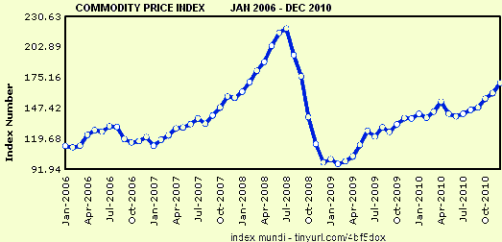
Bernanke was referring to the “beneficial” consequences of his quantitative easing program – QE2 – in which he is buying $600 billion in Treasury securities through June. Notice how he also touted the pick-up in inflation to “more normal levels.” Really? What central bank chairman can say with a straight face that the commodity price increases we just saw in the last month were normal: wheat up 6%, sugar up 6%, corn up 8%, rice up 10%, hogs up 10%, and cotton up 17%? And this was just January. Here we are four days into February and commodity price increases are accelerating. Do you think the market might have noticed that one of the Fed governors said the Fed is now actively discussing QE3?
What Could the Fed Possibly Have to Do with Riots in Egypt?
When asked about these increases in commodity prices, Bernanke said they weren’t his fault. Emerging markets economies are growing so quickly that demand for basic foodstuffs and other staples is outpacing supply. Besides, unusual weather conditions like droughts in Russia and floods in Australia are diminishing crop yields. This is all true, but the natural disaster story only works for some commodities for a specific period in time. It doesn’t explain why so many commodities are in a speculative fury, and why the speculation began on the very day Ben Bernanke announced the Fed was considering QE2. Nor is it a coincidence that stock markets began to rally in the US on that same day as well. We may be expecting too much for a trained economist such as Ben Bernanke to understand this, but if the central bank says it has $600 billion it is going to inject into the markets, and it wants to see the stock market go up, and it wants to see commodity prices go up, and it will guarantee that prices won’t go down, investors and speculators are going to buy stocks and commodities.
So the question increasingly facing the markets is whether Ben Bernanke and his fellow governors are being naïve, or disingenuous, or just mentally challenged when they say rising asset prices have nothing to do with their QE2 program. You could see the business reporters scratching their heads in wonder when Bernanke replied to a question about his responsibility for the riots in Egypt by saying the Fed had nothing to do with this because Egyptians buy food not in dollars, but in Egyptian pounds. Doesn’t he know that the Egyptian pound is pegged to the dollar, and commodity price increases feed directly into their economy because almost all commodities are priced in dollars?
The good news about this press conference is that at least the business and financial press are starting to understand that raging commodity prices are both closely associated with the Fed’s quantitative easing programs, and that these price increases are the one constant theme in anti-government protests from Algeria to Tunisia to Egypt and elsewhere. Egyptians have taken to the streets for reasons beyond just the cost of bread and coffee and sugar, but this has in every one of these countries been the spark that ignited mass demonstrations, because the cost of food constitutes 40% of the monthly income in most developing economies (compared to 13% in the West).
The press has also caught on to the fact that the Fed way of thinking about inflation is very strange and has nothing to do with the experience facing someone on the street. The Fed looks at “core inflation”, which strips out the volatile components of food and energy, and on this basis inflation is benign. Bernanke is not old enough to remember this was the exact sort of silliness that permeated the Fed in the 1970s during a period of high inflation. The Fed kept stripping out more and more components of the consumer price index that were too volatile and masking the trend in core inflation, which of course always wound up to be stable by definition.
As the saying goes, as long as you don’t eat, don’t drive anywhere, and don’t heat your home, inflation is just fine. Just as you should ignore the fact that Brent crude oil is now priced at $104/bbl, in response to fears about closure of the Suez Canal, and pretend that these price increases are the result of solid economic growth, as Bernanke has said. This is strangely reminiscent of the ridiculous argument both Greenspan and Bernanke used to make before the crash of 2007, when they said US fiscal and trade deficits were the result of a “savings glut” in China and India. In American terms, US problems are always somebody else’s fault.
But Wait! Doesn’t the Economic Recovery Have “Legs”?
What about all those excellent economic results we’ve been seeing in the past few months? The headlines suggest the economic recovery finally “has legs”, and job growth is just around the corner. The problem occurs when you read deeper into the data. The 3% growth rate in GDP was accomplished partly by inventory buildup (especially in autos), partly by record levels of government stimulus, and partly by inflationary increases in the economy. People forget that through the stagflation of the 1970s, GDP growth often exceeded 5% because prices were going up at least by that amount. The dry rot occurred underneath the surface, as savings decreased and profits fell as well.
The same thing is beginning to happen today. Companies are recording strong revenue growth, but they can only grow earnings by cost cutting. We’ve seen many companies this quarter announce “margin compression”, meaning they are paying more for raw materials and basic goods, but they can’t raise their prices high enough to compensate without jeopardizing sales. So revenue growth, strong as it is, isn’t strong enough to offset the rising cost of goods sold. You can see this also in the service and manufacturing monthly performance reports, which headline growth in these two sectors at levels last seen around 2005. Dig deeper, however, and you find “prices paid” by companies are growing at an even faster rate.
Choose Your Poison: Stagflation, Inflation, or Deflation
This may be an economic recovery that has “found legs”, but they are the wobbly legs of inflationary growth, not sustainable, healthy growth. This type of economic recovery leaves the United States, and the global economy for that matter, with three possible paths: stagflation, inflation, or deflation.
Stagflation would be the best possible outcome. Unemployment would remain high – US unemployment is down to 9.0% as of this morning’s report, but much of the decrease stems from dispirited job seekers leaving the labor force. Inflation would also remain high, courtesy of the Fed’s attempt to artificially create demand through inflation (something that has never been done successfully before). The economy would suffer through a roller coaster ride of anemic recovery followed by a recession, in a repetitive cycle.
Inflation, or even hyperinflation given the gargantuan amounts of monetary stimulus being placed into the economy, is another possibility. This is what the market seems to fear the most, and you can bet on this outcome if you believe that there is no group of people or force that can stop Ben Bernanke and the governors of the Federal Reserve. So far that has been a good bet. The central bank operates without external controls or oversight of any sort. Congress complains but does nothing to rein in the Fed – and in some respects this is logical because the Fed is enabling both Congress and the Administration’s enormous propensity to borrow and spend since the Fed is buying up most of the debt instantaneously. The new Congress is filled with Tea Party types that supposedly are shocked and appalled at deficit spending. We shall see if these people have the courage to stand up to the Fed, and if they do whether that is enough to put a stop to the quantitative easing programs. If not, we are in for a potentially serious bout of uncontrollable inflation that can only be stopped with painfully high interest rates, and the replacement of Bernanke by someone like Volcker willing to impose such pain.
This, however, is ultimately no different than shutting down the economy now and liquidating the debt overhang that got us into these problems in the first place, and have been made much worse under Bush and Obama’s bank bailout programs. Liquidating debt on a large scale is deflationary, and this is option number three if done right away, meaning QE2 comes to an end and Washington really does start to do something about deficit spending. The economic contraction will be severe, no doubt, but it will be less severe than if the US continued on path number two, which ultimately can only be resolved with a greater deflationary shock to the economy.
Option three may not be as sure a bet as option number two, because a withdrawal of quantitative easing represents immediate pain for the banks that constitute Ben Bernanke’s principal constituency. Every day the Fed buys up Treasuries under the QE2 program is a day that the banks as primary dealers in government securities are guaranteed fee income of tens of millions of dollars. It’s no wonder that bankers bonuses for 2010 were at record levels. If there is one thing we’ve learned in this financial crisis, now into its fourth year, it is never count out the ability of Wall Street and the banks to find their way to the greatest possible profit. This is priority number one for the financial sector, and because the financial sector has captured the hearts and minds of the Fed, it is the first priority for US monetary policy.
Who Says You Can’t Fight the Fed?
If the US can’t constrain its own central bank from ruining the nation and the global economy, it will be up to the financial markets to punish the US in order to put a stop to the madness. This is already happening in at least two ways. For one, long term interest rates on Treasury securities have headed up along with the stock market and commodities prices ever since Ben Bernanke began publicly discussing QE2. The original stated purpose of QE2 was to keep long term interest rates lower, but this has been such a pronounced failure that Bernanke didn’t even mention it in his press conference this week.
The second source of pressure is jaw-boning. Some of this we saw yesterday when reporters repeatedly challenged Bernanke on his assumptions and claims, but since Bernanke only gives these press conferences every two years, we will have to wait until 2013 for the Chairman to be publicly tested on his policies. The Fed is, however, losing ground globally. Not a week goes by when some Chinese official doesn’t castigate the US for its destructive monetary policies, and this week Mervyn King, Governor of the Bank of England, gave an extraordinary speech where he took to task “other central banks” for perpetuating and initiating asset bubbles. King made it very clear to the British public that there is nothing the central bank can do to forestall the decline in living standards that is the result of liquidating bad debts in the economy. He also apologized to all the savers and others who behaved “prudently”, and acknowledged that zero interest rates were a direct transfer from the prudent to the bankers who blew up the economy in the first place.
Such honesty is rare in central bankers, and non-existent at the Fed. We still don’t even know if Fed officials actually believe the ridiculous things they say, or whether they are merely acting stupid to hide the fact that they have created a world in which financial prudence is punished, those who save are forced to subsidize those who speculate, and people around the world are rioting just so someone will notice that they can no longer afford to feed themselves or their family.
First published in The Agonist.
Comments
sorry, that's inaccurate
Q4 GDP was not inventories at all, in fact it detracted significantly, it was the deceleration in trade and one could argue that is due to a weaker dollar and even further argue that QE2 had something to do with it.
GDP has price deflators in it, that's what real GDP means and is the number reported and used, in other words, real GDP is already adjusted for inflation. That is the 3.2% number and it's not 3%. Here is the report overview, look for yourself.
Then, commodity bubbles, remember those? We only had some in 2008 called oil, which were heavily influenced by speculators and we have the never ending claim supply must be there, when a picture of a bunch of parked tankers hidden out at sea emerged. Ben wasn't around, there was no such thing as QE2 at that time.
I'm not jumping on this boat until I've taken a look overall at commodities. That said, a weaker dollar should affect U.S. commodities, esp. imports, not exports or food to Egypt, unless of course we have our flash trading speculators again and oil, which is tied to food, is trading in U.S. dollars.
Sorry, I'm not pal of Ben but let's please be accurate and dig around first before blaming Ben Bernanke on food shortages and revolutions.
Agreed - inaccurate
well said -
it is after all the Chinese currency manipulation and the resulting effective exporting of unemployment to the US economy (helped by sycophant and ehtically-challenged US offshorers, TBTF wall st banks, and a political climate for the highest-bidder) that has led to the need for efforts like QE2 to try to reduce unemployment
re: the spike in food prices, per Paul Krugman, “the data suggest that the key cause is terrible weather leading to bad harvests, especially in the former Soviet Union.”……that there’s been “……a huge global harvest failure.”
more inaccurate
Well, I'm reading the "Event" now and Bernanke should be blasted for ignoring oil and food commodities increasing. He's out of his mind not to be concerned, there is a lot of evidence and analysis that oil shocks precipitate recessions. Not a good thing and the correlations are pretty strong.
So, here comes Krugman, this is redux. We did a whole lot of analysis during the oil bubble spike in 2008...Krguman argues there must be supply somewhere,
myself, I lean towards our friends, derivatives again and speculators...
the main argument is commodities must follow the laws of physical supply and demand because at some time someone must take possession of the physical commodity, therefore increases in futures and commodities must be simply a demand problem.
Because about the time oil dropped, we got Financial Armageddon, so the entire oil commodities speculative bubble was speculators or actual demand, really never got resolved.
That said, there sure is a lot of evidence that our lovely derivatives traders and speculators were at work, including a Krugman back up....a bunch of oil tankers holding loads way out to sea...parked. Someone took a snapshot.
So, this entire blame Bernanke QE2 freak out, honest I'm not so sure, but there is no doubt spikes in commodities were going on in 2008, before TARP, before M2 on rocket fuel and before QE2...
That said, ignoring oil, i.e. energy and food is truly not in reality and accordingly the bloggers and blasters should be out paddling him with their words today. Bad Bernanke! Bad!
Worthwhile points
There were three important points that I took from this article, which I thought was outstanding. The first is the notion of the one way markets outlined in the first section," Fed Chairman Ben Bernanke keeps repeating that a rising stock market with low volatility is a monetary objective of the central bank." That is in the tradition of TARP and the massive giveaways. Wonder how Ben got appointed to make that decision?
The point on commodities is also important: "Besides, unusual weather conditions like droughts in Russia and floods in Australia are diminishing crop yields. This is all true, but the natural disaster story only works for some commodities for a specific period in time. It doesn’t explain why so many commodities are in a speculative fury, and why the speculation began on the very day Ben Bernanke announced the Fed was considering QE2." Commodities are going up for a number of reasons AND there was a precise correlation between the QE2 surfacing and commodity speculation. This raises serious questions.
The third point concerns the relationship of Fed Policy and rising commodity prices. Numerian pointed out the lack of cognitive skills on the chairman's part when he noted:
And, this interview is interesting. Makes the same point Numerian made:
Did the economy cause unrest in the Arab world?
Hedge fund manager Bill Fleckenstein explains how decisions made in Washington, D.C., Wall Street and Beijing may have sparked the protests in Egypt.
Read BLS. 3.2% is right.
We may be seeing the roll out of a new tactic by The Money Party elitists. Just starve them until they cooperate. More likely, if Bernanke was not clued into the impact of food price games on entire nations, nobody else was. What some people are seeing as a sinister strategy is probably just ineptness and limited cognitive bandwidth;)
Michael Collins
wish these were in the original articl
I think you made a typo, but it's real GDP, not Read BLS.
If their currency is pegged to the dollar, I can then see QE2 affecting Egypt more, yet, China is pegged to the dollar and they are not having these crisis. But, what was the percentage monthly increase in Egypt leading up to the protests on food? Chart it out we may get some answers as well as global food commodities and then those based on the U.S. dollar.
The Guardian is more what I'm referring to on the speculation commodities that probably was also happening in 2008. But to the Krugman argument on oil at least, demand did drop, but on Food, it's really had to claim demand dropped while more people are born every day.
wish these were in the original.
Unemployment
Many of the protesters in Egypt are out of work - long term out of work and young.
Business Week has a good article on this that seems to ring true.
Helicopter Ben's machinations to get the stock market and housing market back to where they were just before the crash have done nothing for employment. Employment is being handled by stats. We're down to 9% yet there is no public explanation as to the 750k who dropped out of the work force and therefore off the stats in the last two months. A good example of statistics being used to make a case. By the time Obama is running again unemployment will be way way down on paper yet I doubt there will be any real improvement other than on a faux statistical basis.
The economy there is seized and I understand there are runs on the banks.
Economics aside the US has supported the longest standing dictatorship in the 'free world' in order to keep peace for Israel. The population there be damned.
read the two unemployment posts
I'm seeing a host of people, some extremely credible, still, not get the data methods on the CPS survey. The key is that noninsititional civilian population graph.
Posts here and here and pay key attention to that monthly percent change in the noninstitional civilian population graph. From all things derived comes from this base number, it's the superset of the unemployment statistics, i.e. the universe where all other numbers are derived from.
The have to game unemployment
U6 is easy to understand but kept in the back room like Cinderella by the ugly ducklings in the front room. Here's an interesting source of unemployment and other stats: Shadow Government Statistics
Here's a small part of the explanation on U6 and the official version of unemployment:
Where the household survey includes farm workers, the self-employed and workers in private homes, the payroll survey does not. The payroll survey counts jobs, making no adjustment for multiple jobholders. Yet, adjusting for all differences, the BLS never has been able to reconcile the two series within one million jobs. Employment and Unemployment
Here's their latest on the various unemployment rates:
Any reasonable judgment of the value of unemployment statistics would rely on the broadest measure of those out of work. U6 is closer, although, according to this chart, it has its limitations. But the official unemployment rates are way short of those who want to work and are not and those working less than they want.
Michael Collins
"gaming" employment statistics
I would claim it is not "gaming", although tracing through the politics of statistical methodology would be an interesting history post, more the issue is the baseline noninstitional civilian population methods. This is clearly screwed up when one is using the baseline number from the 2000 Census when it's 11 years later. Add to that this 60k survey, that just is way too low!
They are using data, from the 2000 census to estimate the number of households....STILL...114825428, that is 0.052% of households and that's households estimated from base 2000 Census data.
No way, even when limiting the sample to noninstitional population.
A good piece is the wikiedia on CPS.
Bottom line statistics are only going to be as good as your raw baseline numbers. If those are off, everything else will be off.
Shadow statistics is interesting but they have also their own problems in methods. The minute you see opinion instead of mathematics and numbers and assumptions, baselines.....in something as massive as what's happening in a population of 307,000,000.....
question it. for example, a 1% error rate on 307 million people is 3.07 million people (which is why I find big pharma absurd when they claim "risk of death is low" from our drug, it's only 1 %....WTF, that is HUGE!)
So, 1% sounds like no big deal but when you get into large numbers, it's a skew from hell.
What we need here is better raw numbers off of which to work with. That's the bottom line, updated, monthly, real time numbers. Updated, monthly corrections on the baseline numbers upon which all is derived. One could say this for the CES as well, I mean come on, what is this statistical birth/death model of businesses and jobs and even seasonal adjustments...what the hell, we cannot get monthly real time data from every business out there operating in America in this day and age of real time texting? Why not? (Seasonal adjustments, I have not dug into but obviously applying anything that is a linear prediction model based on past historical data is going to have some errors when entering a non-linear universe)....
Anywho, raw data collection not a big burden here man, it's 2010, not 1900 and we have automatic database input technology....
Verizon and AT&T would love the additional data real time into a database...they can charge more for bandwidth. ;)
Ya know, gee wiz, just extrapolate out those w/o real time communication input devices and start using data from the modern world...
I mean how many busineses are going to have 5 employees if they do not have a smart phone, we seriously cannot extrapolate market penetration from industry from this?
But I digress...
Anywho when you dig into the methods, the sampling sizes, the error rates and the assumptions, recall how Insurance companies claim credit scores are somehow correlated to your ability to not wreck your car...
and wonder, hmmmm, now what kind of factor is that being claimed?
So, before slamming government statistics, I think first and foremost is to discover their methods, understand it plus the error rates, all taking into account trying to give statistics on a nation-state of this size.
Oh yeah, it is pure politics why the government will not collect immigration status on employment, 100% and that's just bullshit, because numbers are numbers and statistics are statistics until you get a bunch of political special interest groups not wanting certain information to come to light.
Gaming in the broadest sense
i.e., using "the official" unemployment figure instead of U6 or a better alternative. It's worth a read of Shadow Stats to see his justification on methodology. His alternative is much higher than U6 but he has a rationale. I'd like to see someone do a reconciled unemployment chart that adjusts forwards and backwards for different eras, based on the official version at the time. I tried to figure out out but it's above my pay grade.
I think that the government statisticians do a fine job. They'll satisfy the requests of their departments. The US Census is particularly skilled at weighting and generating sound methodology for counting as many people as they can.
Michael Collins
some gov. stats seem better than others
My point is the BLS is dependent upon Census data and their sample size to me is just way too small and that's because "all things are derived" from that noninstitional civilian pop number. Shadow stats seems to say that's all ok and not from any statistics and large number theory I know. That said, this stuff is very complex, to maintain statistics of large numbers, i.e. government statistics.
Even on U6, I think it's low balled personally. I'm so busy trying to dig out the missing from the statistics, I haven't calculated the "real" unemployment rate.
to me, it's become meaningless in so many ways, the actual rate due to all of these problems, so I have a tendency to focus on the millions not counting the number of jobs needed, try to get a feel for the real number of people needing a job, but more absolute quantities.
How about an "Unemployment Index"
ShadowStats likes U6 for a number of reasons. U6 is 60,000, more than enough for a random sample and it captures available/willing workers plus the under employed.
You're right, imho. The number of people needing jobs is the real measure. The jobs needed is of real interest but not the main point. Those available and willing to work, yet unable to find it, is a critical measure for policy reasons. If we knew just how large that population was, if that were common knowledge, i.e., the official figure, THEN we would know just how devastating it is to ship manufacturing and professional jobs overseas.
Germany seems to have unions, high numbers of skilled professionals, and relatively low unemployment - 7.4% Feb 1.
Here's their calculation. The German measure is broader than U3 since it captures "the self employed and family workers." U3 is samples payroll tax filings and misses these two important groups.
So when you look at lets say, 9% unemployment for the US and 7.4% for Germany, there's a lot more than a 1.6 point difference.
Michael Collins
CPS captures that as welll
it captures the self-employed and unpaid family workers. I don't know where you get the sample size is just fine, I just calculated the percentage ratio and that's just too small for a nation which has become as diverse and this one is with 307 million.
Real Numbers
Michael,
It would be nice if the numbers were all inclusive. As it stands now, even the 9.0% unemployment number doesn't begin to tell the whole ugly story.
For Example:
(1) How many unemployed have given up looking.
(2) How many are unemployed due to illegals, job out-sourcing, and businesses relocating outside of our borders.
(3) How many are unemployed due to foreign trade agreements ( closed plants, lost industries ).
(4) How many honestly want full-time jobs, but are being forced into part-time employment.
(5) How many are entering the workforce for the first time ( high school and college grads ), but are not included in the unemployment numbers.
(6) How many employed are working for much lower wages than they were two years ago.
(7) How many employed still qualify for government assistance.
(8) How many foreclosures and bankruptcies are directly tied to unemployment.
(9) How many homeless are directly tied to unemployment.
(10) How many are without health care insurance that can be directly tied to unemployment.
(11) How much lost tax revenue can be directly tied to umemployed members of our workforce.
(12) How much of our national debt can be directly tied to unemployment.
(13) How much lost productivity can be directly tied to unemployment.
(14) How has unemployment affected the number now living in poverty.
I would guess that the answers to the above would change the bottom line concerning the real unemployment picture. As it stands now, the numbers given us monthly doesn't come close to the real unemployment figures. And certainly doesn't paint the true picture of how harsh and devastating present levels of unemployment really are.
Because you can do wrong, and get away with it, doesn't make it right
I'll add political numbers
There has been enormous effort by Congress to demand a reporting of jobs directly offshore outsourced as well as created offshore, instead of the United States. They were blocked at every turn by corporate lobbyists who don't want those numbers out.
Multinationals really hide them, even in press releases, they even refuse to list their employee numbers by country.
Then, on immigration status reporting from the Census, that too is a major political block, many have tried to get that included, as it is they refuse to even use E-verify for employment...
it's really bad for foreign guest workers, for they are so massive and displace U.S. workers just as much as offshore outsourcing does....in some occupational sectors, such as I.T., they literally bias the employment statistics to fiction.
This is kind of why I'm railing on all of this, it's the raw data we need to be screaming about. Just like Eocnomic theory, if you get garbage in, you get garbage out and without accuracy, there is no way good policy is going to be prescribed to put Americans first and foremost in the jobs market or as an agenda.
Duck'in and Dodg'in The Root
Robert,
Yes, I totally agree that the problems are 110% political. It is the failure of government "to protect and to serve" ( their sworn duty and obligation ), that keeps our workforce idle. An excellent example of government "duck'in and dodg'in" the root causes can be found in Mr. Obama's speech Saturday 2/5/11.
"It's a two-way street to prosperity, President Obama told U.S. businesses on Saturday. Government has an obligation to make sure that America is the best place on Earth to do business, but companies in turn should make their mark in this country. They should set up shop here, and hire our workers, and pay decent wages, and invest in the future of this nation, the president said". ( from "Politics Daily.com" )
Notice that Mr. Obama never mentions changing the unfair, unjust, and one-sided foreign trade agreements, nor does he mention penalizing and severely restricting job out-sourcing. He never mentions the fact that government is responsible for what we're seeing now. He plays it off like business America is the villain, and Washington has clean hands. It is the failure of government to protect the opportunities that allow Americans to earn a living wage, and for them to be self-supporting. It is the failure to legislate, pass, and enact pro-America agreements and policies, that's at the roots of what we're experiencing today in this country. Our workforce is dealing with external forces ( The Washington Brotherhood ) that they basically have no control over.
John Q. Public doesn't get to vote on the floors of Congress. As I've said many times, we would have more than enough jobs if Washington would legislate, pass, and enact, fair, equal, and balanced foreign trade agreements and policies. We could put America back to work, producing what America uses and consumes. But, as long as The Washington Brotherhood ducks and dodges the roots causes for our steady economic decline, don't expect anything other than what we're seeing now. I have never ever heard our government say that they are to blame, and accept full responsibility for unemployment, poverty, closed plants and factories, lost industries, and our steady drift towards third world status. And, we can include the fact that they accept no responsibility for job out-sourcing offshore.
Because you can do wrong, and get away with it, doesn't make it right
State of the Spinon
State of the Spinon.
Great questions
Those are my favorites. To answer them, we'd need to use the governments U6 measure, rather than the the official measure, U3. Able workers not working defines the true impact for questions 11-13. If we use the smaller official figure, then there's no way that optimum employment, however that's defined, can do what's needed. In reality, the U6 figure is 7 points above the 9% official figure (forgetting, for a bit, the ShadowStats.com figure of 23%!). If you define "full employment" as 5%, then getting there from the official figure gets you 4 points, as opposed to the 11 points provided by the 16% U6 number. That's a huge difference in terms of cleaning up the mess we've got.
Michael Collins
question answers
Productivity is already answered and it's not directly correlated to unemployment, answers here.
I've written up lost tax revenues in the past but those can be determined but on national debt it's inferred through lost tax revenues but I haven't calculated it out to the unemployment rate myself.
Productivity and Taxes
Robert,
Just curious here. You said, "Productivity is already answered and it's not directly correlated to unemployment." Questions: "IF" 125 million workers are employed, do they not produce more than 75 million workers would? "IF" we had 4% unemployment instead of 9% unemployment, wouldn't we be producing more? "IF" productivity doesn't correlate to employment, what did all of the employees do when the unemployment rate was down to just 5%? Are you saying that we can produce just as much with 9% unemployment as we can with 5% unemployment? Could we produce just as much as we are now "IF" the unemployment rate was 18%? What employment rate would allow us to produce max output of goods and services?
Concerning tax revenue:
When workers are employed, with spendable income in their pockets, they support retail, which means sales tax revenue. When workers are employed, it means payroll tax deductions. When workers are unemployed, they have less spendable income, and pay zero payroll taxes. So, common sense dictates that unemployment adversely affects tax revenue, both on the local and state levels, as well as on the federal tax revenue level. Less tax revenue means more debt, less services i.e. teachers, police officers, etc., and less tax funded projects.
In summary, unemployment means lost productivity, lost tax revenue, and more debt. In addition, as we're seeing now all across this nation, it means more bankruptcies, more dependency on government assistance programs, more citizens falling into the ranks of poverty and homelessness, and more negative pressure on retail to stay afloat.
Because you can do wrong, and get away with it, doesn't make it right
labor productivity is hours, not people
I go through these definitions, calculations and put up graphs, then link to additional research for a reason. I do not want to have to restate the definition of labor productivity when I just wrote up a detailed overview.
Q4 2010 productivity and costs.
Folks, ya all need to read the Instapopulists for a metric doesn't mean what you think it means. If you go through the definitions and the methods, that gives a clearly idea of what it means.
At the bottom of that post is some pretty solid research showing labor share has declined dramatically in the last decade and there definitions, methods I find particularly valid, for they deal with the fact price indexes are uses for output (to remove inflation) and CPI is used for real wages and how those two are different.
But please folks, consider reading the economic report overviews to get these definitions and concepts down. I always link to the original government website for further learning and FRED graph, I've given many links to them as well as an analysis/educational tool.
Common Sense, Simple Logic
Robert,
I'm not asking you to restate definitions, show graphs and charts again, nor am I asking you for more government issued data. In my opinion, I asked legitimate questions in response to your statement that unemployment does not correlate to productivity. I'll accept common sense and simple logic answers. There's no need to produce, or repeat definitions.
Also, data issued by the government, is just that, government issued data. Do you accept the government's take on everything? Do you believe that our government is completely upfront and honest with the public?
The government tells us that we're headed upward, and should be out of this economic mire within the next couple of years. Do you accept their take on our economic nightmare?
I also use government issued data, but I'm wise enough to read between the lines. It's not difficult to separate the chaff from the wheat.
Would it be wrong to assume that 20 employees could produce more in one day than 3 employees? What, exactly, is wrong with the assumption that 125 million workers can produce more than 75 million workers?
I fully understand that you're a stickler for data, charts, and graphs. And, I can well appreciate that trait in you, it's to be admired. But, it's not so much the data, charts, and graphs, as it is the source of that data, charts and graphs. The point being, if government issued data says that our economy is growing, yet Main Street presents an entirely different picture, what do we believe? An example would be the government issued unemployment numbers that we've been talking about for awhile now. Even you disagree with government issued unemployment data.
Because you can do wrong, and get away with it, doesn't make it right
the basic definition of labor productivity
is what it is and it's not just the U.S. government it's all governments, that's the definition.
The government is the only data collection you've got, so assuming the methods are ok, which is what I look at, a lot of government data, I do think is credible.
That said, it's not 100%, which is why I pour over these things, but in the case of labor productivity, scroll down to the bottom and click on that paper, there are your Federal workers telling you, with their own data, something is wrong, that labor is not sharing in productivity increases and that's not what the case used to be...
which is why labor productivity shooting up, used to be good news for workers and now it's more bad news.
There's more to this, but first is to get those basic definitions down. If you notice I'm forever railing on offshore outsourcing, insourcing trade, so clearly I'm hunting for data which shows how much damage has been done to the U.S. economy, but also try to amplify what is not tabulated by the government, which isn't these various data agencies fault, it's Congress's fault, they are the ones, along with the executive branch, who can get more data points collected, such as requiring all corporations to report the # jobs offshore outsourced, the number of jobs and investments globally, per country, the number of guest workers...
But button line to talk about productivity, first is to get one's head wrapped around the basic definition, concept, which is output/hours, which does not mean more for workers.
Which Is It ?
Robert,
So, which is it? Are you still saying that unemployment/employment does not correlate to productivity?
Are you still saying that whether 125 million workers are employed, or whether it's 75 million workers employed, the numbers do not correlate to productivity? In other words, the amount of output will be the same? And, if the amount of output is the same, what are the other 50 million workers doing? Are they standing around just watching the other 75 million produce? Please explain. I don't follow your reasoning here.
EXAMPLE :
A tool company makes hammers. During it's peak, the company produced 300 hammers a day with 20 employees. Since the recession, it was forced to cut-back to 6 employees. Now the company can only produce 90 hammers a day. Given this example, does unemployment/employment correlate to productivity?
When the recession hit, GM cut-back on the number of employees. Some were ask to take early retirement. After the cut-back, production decreased. Was this decrease in productivity from more or less employees on the payroll? Or, did GM produce the exact same number of vehicles with less employees?
A farmer can plant and care for 1000 acres with 12 employees. But, he can only farm 500 acres with his present payroll of 6 employees. Does unemployment correlate to the farmers productivity/production/output?
Because you can do wrong, and get away with it, doesn't make it right
read the definition
Again, read the definition and frankly I am getting more and more frustrated, when this site is all about economics, the refusal to pay attention to definitions and economic metrics.
I just pointed that labor productivity is a ratio, as defined in the equations, which, again, read the overview on Q4 Productivity & Costs. I literally put the entire equation, definition and point to further equations, definitions on the right page out of thousands from the BEA for readers to learn what this metric is and measures.
Do you not understand ratios? Is it fractions causing the issue here? How one can increase the numerator or decrease the denominator? That 6/12 = 1/2? That 3/4 > 2/3?
The statistics, right below, on Q4 Productivity show, a decrease in unit labor costs.
This is not a static relationship to # of workers, which is the point of this metric.
Now, if you do not understand fractions, or need help following how they use real GDP and why for output and other questions, please post under that thread linked above to be on topic in comments per the actual post.
I also do not appreciate my name in comments, as if somehow a mathematical equation would become variant with this never ending stuff. A mathematical relationship is time invariant, it's a ratio. So, in other words, trying to argue with a mathematical equation or definition is like jumping off of a building over and over expecting gravity to change because you do not believe in it.
Again, please post questions in the actual productivity thread and once you wrap your head around those basic definitions, then I will deal with any sorts of statistics, reports, theory, errors that I made in the overview or methods of the BEA and correspondingly Census.
Understood
Please accept my sincere appology for using your name when responding to your comments. I did not know that was one of the rules here. As you know, I'm relatively new here, and I'm trying to learn your rules.
I will drop this thread since it seems that you and I are comparing apples and oranges. I'm not real sharp with fuzzy math and the government's dictionary which defines "productivity". It kinda reminds me of Bill Clinton's definition of what is and what isn't sex.
Again, I appologize.
Because you can do wrong, and get away with it, doesn't make it right
comment protocols
Generally people's names are already in the comment, so you already know who authored it, therefore do not often need to respond by name, so reposting someone's name implies "confrontation" or "argument", as your mother would call you out by John Parker Louise, when one is in trouble for not doing their chores or whatever.
Generally comments should be in response to the article/blog topic, piece.
There are things called open threads, which on this site are all of the series, which are the "links" or examples are Saturday Reads, Superbowl reads, the Friday Movie Night, which are economic related or political related documentaries, then the Sunday Morning Comics, which are the weekly "editors choice" economic related funnies.
So, on open threads, anything goes in a comment.
This is not fuzzy math, but the economic definitions used by economists. that implies one needs to buy that Macro econ 101 (really Econ 201) book, such as Paul Samuelson's...you can pick a copy up for a buck or two of earlier editions, which works pretty good because the new editions are usually > $130. He wrote that book and it's kind of the intro economics "bible", in the 50's or something, so each edition just adds, but economic theory the basics, haven't changed since it's a science in this regard.
If you do not understand the definition, they you are not talking about productivity, you're talking about something else.
This isn't Apples & Oranges, to argue economics one must first understand the basic definitions being used.
Then, on math, I do my best to boil down mathematics to their basics where I believe high school math should cover it, but yeah, it does require people to be able to stretch their brain.
If you spend the time getting this stuff down, then after that, it's possible to understand what other economists are arguing about. I think productivity is one of the harder concepts to understand.
It's counter intuitive in many cases, esp. of late, but it's output per hours. That's the key, then you've kind of got to have ratios, relationships as a concept in your head. i.e.
output goes down & hours goes down even more => labor productivity goes up
output goes down & hours goes up => labor productivity goes down
output goes up & hours goes down => labor productivity goes up
ratios, one needs to kind of get what they mean in their heads. for example, everyone knows what a foot in length is in their brains as a concept, but ask most Americans what a meter is and how many feet are in a meter, they will not have that in their brains.
But you cannot redefine a economics metric, doesn't work that way, for example, you cannot just claim the laws of supply & demand do not exist because one doesn't get that intersection point. the law of supply & demand is another key concept.
But you need to start writing comments in respond to the corresponding post and getting your head wrapped around these economic definitions.
What Does Q Include?
When an iphone is sold for instance just how much of that is attributed to Apple and how much is attributed to the contractor in China where people are killing themselves on the job?
I could see where value in the chain could be misrepresented by profit rather than production.
I think the example I read here some time ago said that the Q is inflated to show overseas labor efforts and attributing that to US labor. I don't know myself just putting that out there from memory.
Q
and we should be chatting over here, but Q is output and for nonfarm business productivity that is 75% of real GDP.
So, what is GDP? I guess we'd have to go to the GDP report.
It is supposed to be that all imports are subtracted and that includes intermediate imports, such as our Foxconn slave labor. The finished iphone comes in as an import. the export would be the design. The profits would be Apple and where they are parking those profits, say the Caymans, is that entire "tax incentives to offshore outsource your job" thing.
yeah, that's in the research on phantom GDP and improperly attributed productivity. I link to a good 4 research papers in this post, but to date, I haven't gone into these actual statistics via the BLS/BEA/Census and tried to locate the productivity elements being wrongly attributed.
The BEA claims this isn't a problem, yet they also mention the difficulty with measurement with these intermediate offshore outsourced parts of goods..
then, in terms of using people by importing them as guest workers, illegal workers as well as offshore outsourcing services, I have not seen anything to account for that...
Looks like I need to go read up again on the latest, because this research is a couple of years old...
But it is true, the BEA does a lot of price deflators and price indexes to deal with differing economies, prices, exchange rates and inflation rates.
So, officially, no answers where the Chinese in the iphone are inside GDP, but we know this has to be "somewhere", so might be time to review the latest research.
This is what I mean about "philosophies" versus hard equations and statistics without bias, there is alot of spin out there on this topic, even though anyone with common sense can see the effects every day....so somewhere, something is screw up in the actual statistics, methods or "Missing data".
A Fundemental Change
In the past inflation could be tamed by overproducing petroleum driving the cost down. Now that is no longer possible.
http://www.oilnergy.com/hpix/4usaoil.gif
In the 70's the US had to deal with declining national petroleum production rates and stagflation was something new.
After 2005 the world now has to deal with declining global production rates. Dieoff is something new.