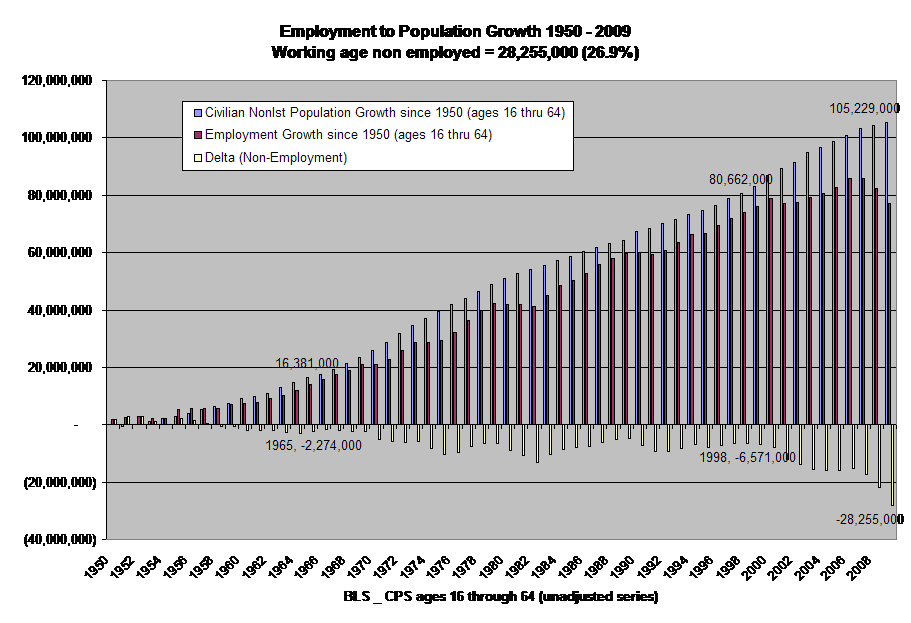
In the population of working age adults, the non employment rate is 26.9% (28,255,000 of 105,229,000). As a comparison to current levels, in 1998, the working age population growth was 80,662,000 and the non-employed in that population was 6,571,000 (8.15%).
This graph displays a Non-Employment rate of 26.9% among the working age population. Measuring employment growth to population growth since 1950, persons under age 16 and over age 64 are excluded from the BLS-CPS data-set(s) to make a determination of "working age population" and "working age employment".
(Larger graph here)
The working age population and working age employment data-subsets are aggregated to produce growth statistic(s) starting from end of year levels in 1949.
The "Delta (Non-employment)" growth values are shown as negative for display purposes. This Delta is the difference between the working age population growth and working age employment growth. Of the 105,229,000 in the working age population, 28,255,000 were not working on Dec. 31, 2009. Keep in mind that the BLS-CPS definition of "Employed" is fairly liberal and includes self-employed and part-time workers.
As a comparison to current levels, in 1998, the working age population growth was 80,662,000 and the non-employed in that population was 6,571,000 (8.15%).
Since 1998, the working age population has increased by 24,567,000 (30.5%) while employment in the working age group increased by only 2,883,000 (3.9%).
Observations:
One phenomenon to observe is that as the nuanced trend in population inclines, the employment rates decline correspondingly. The converse is also true where the population trend-line would decrease somewhat, employment levels increase.
Another observation is that when measuring employment data in this manner, the earlier years include persons who were already of working age when the BLS began publishing CPS (Current Population Survey) data. Due to the age constraint determined as the working age, the sample now contains 100% of the working age population from entry to departure (i.e. 2010 - 49 (years in working age population) = 1961 (entrance into working age population)
Assertions:
One thing the U.S. could do to alleviate this non-employment problem is to determine immigration levels dependent upon historical gains and losses in working age employment. Currently, immigration levels are static throughout recessions and early business cycle recovery, these are the times when native workers are the most vulnerable to immigrant labor "crowding-out."
By observing the employment growth statistic as a metric for governing legal immigration quotas, the government may find the resources and motivation to curb visa-overstays and illegal immigation if policy objectives included higher legal immigration levels.
.
In the case of high-skill immigration, aka H-1B and L-1 visa, employment growth could be observed within individual occupations,
new H-1B holders have assumed 52% of employment growth in the IT sector in the 2004 to 2009 period while U.S. IT degrees conferred to Citizens and Permanent Residents greatly exceeded employment growth.
The question to Congress in any immigration legislation should be, “What percentage of employment growth, dedicated to foreign workers, is acceptable in U.S. immigration policy?”
Source Data:
BLS - Current Population Survey
Labor Statistics Data
| Series Id: |
LNU00000000 |
| Not Seasonally Adjusted |
| Series title: |
(Unadj) Population Level |
| Labor force status: |
Civilian noninstitutional population |
| Type of data: |
Number in thousands |
| Age: |
16 years and over |
| Years: |
1948 to 2010 |
| Series Id: |
LNU00000097 |
| Not Seasonally Adjusted |
| Series title: |
(Unadj) Population Level - 65 yrs. & over |
| Labor force status: |
Civilian noninstitutional population |
| Type of data: |
Number in thousands |
| Age: |
65 years and over |
| Years: |
1948 to 2010 |
| Series Id: |
LNU02000000 |
| Not Seasonally Adjusted |
| Series title: |
(Unadj) Employment Level |
| Labor force status: |
Employed |
| Type of data: |
Number in thousands |
| Age: |
16 years and over |
| Years: |
1948 to 2010 |
| Series Id: |
LNU02000097 |
| Not Seasonally Adjusted |
| Series title: |
(Unadj) Employment Level - 65 yrs. & over |
| Labor force status: |
Employed |
| Type of data: |
Number in thousands |
| Age: |
65 years and over |
| Years: |
1948 to 2010 |
Example Formula: To find yearly working age population growth (X)
A = Civilian noninstitutional population 16 and over
B = Civilian noninstitutional population 65 and over
X = (A Current year - A Previous year) - (B Current year - B Previous year)
Employment growth is determined with the same formula using the "Employed" CPS datasets.
See:
Blogpost for detailed information on H-1B and L-1 visa, IT employment and IT college degrees conferred.
H-1B visa: Impact on Computer-related Occupations 2009
Summary:
From 2004-09, IT employment grew by 602,000. New H-1B initial approvals in Computer related occupations was 315,249 or 52.4% of employment growth, similar temporary foreign worker categories likely raised the temporary foreign worker percentage to above 80% of employment growth. Over a similar period (2003-08), there was an abundance of new IT workers, as U.S. Citizen/Permanent Resident degree production exceeded demand at over 757,000 degrees conferred.

Comments
hello Weaver, a few sections/graphs
Every unemployment report the graphs of civilian pop., participation rate, are graphed up via the St. Louis Fed here. Then last report, I did a few more graphs hunting out the unemployed, here.
Finally, there is an entire labor economics forum, here.
Firstly, what are your raw stats? Where are you getting these from? The definition of civilian population is those 16 or older not in the military or institutions (i.e. mental hospitals, prisons, etc.) So this includes people over the age of 65.
It appears somehow you got the subset, below age 65, but from where? Link?
You might also say that the unemployment statistics, the BLS refuses to categorize immigration status, although they do make it clear that illegal immigrants are counted into the unemployment statistics and we know that they also count foreign guest workers.
Where are you getting those numbers of H-1B, L-1 in total? I'm pretty sure you're on the money but when it comes to these issues, because the BLS subsets, the definitions are pretty obscure and then on top of things, they refuse to count by immigration status and of course getting an accurate tally of offshore outsourced jobs...
one can only estimate....
we need to do triple checks on numbers. EP is a news source, so it's up to us to make sure we're accurate here.
Data Sources
Hey Robert,
To be clear, the graph represents non-employed not unemployed. So the graph represets the Unemployed plus the Not in The Labor Force for the working age population. I find it astounding that the number(s) and percentages have tripled since EOY 1998.
The BLS CPS data:
For each year in the NonInst Population (16 and over) I subtract the total of the prior year's population to find yearly growth. I did the same with the 65 and over age group to find growth in the non working age population and subtract the over age from the total NICP in each year. The same formula is applied to BLS CPS "Employed" in the two age ranges.
Example: To find yearly working age population growth (X)
A = NICP 16 and over
B = NICP 65 and over
X = (A Current year - A Rrevious year) - (B Current year - B Previous year)
The same formula is used to find working age employment growth from CPS Employed datasets.
Again, the negative numers in the graph is the delta below full employment (100%) for display purposes.
Non Immigrant data:
The H-1B numbers are factual from the recently released H-1B Characteristics reports at USCIS -- 52% of IT employment growth was absorbed by new H-1B issued in computer-related occupations when comparing to OES growth data for the same six year period.
I estimated the L-1 visa, with a percentage rate drawn from IT related characteristics across the number of L-1 visas issued (to arrive at an estimated number of computer related L-1 workers) and the foreign labor share of new IT employment was over 80%.
The US IT College degrees conferred data is from NSF - IPEDS
Fully documented here
http://immigration-weaver.blogspot.com/2010/06/h-1b-visa-impact-on-compu...
As for my conclusion concerning illegal and overstaying immigrants, the metric I've developed here from historical data would indicate to policy makers to lower or raise legal immigration quotas in the following years based upon the prior year(s)non-employment rate. Yes, it is true that BLS does not concern itself with immigration status, presumably the NonInst Civ Population includes everyone, so we use it as the basis for the employment performance metric.
Legal immigration is the only classification of immigration that the government is in control of, thus fluxuating legal immigration quotas would be the control valve for maintaining healthy employment levels. On the other hand, if the government found the will to control illegal immigration and deport visa overstayers, that may also improve the employment performance metric -- leaving room for higher legal immigration rates.
All I know about outsourced jobs is that India employs 2 mllion in IT and the sector is worth over 50 Billion USD per year to India.
Regards,
weaver
data, sounds reasonable
surely others have estimated 16-64 page from civilian pop? Have you checked with other estimates? That sounds perfectly reason to me as a method.
I think generally when making estimates, to clearly point out your methodology. While the "immigration" argument is visiting EP obviously, that's how we get spin papers or overestimates and when assumptions methods are not listed, it makes the situation worse.
(obviously they haven't read the national accounts methods from the BEA...go jump on those methods please! :))
I can validate the $50B USD of the offshore outsourcing industry, I don't know if it's just 2 million (I'm assuming you mean geographically located in India), that sounds low for some reason.
Anywho, very good work, just a request to publish methods, assumptions, sources.
This is something that truly bothered me about "Stimulus", they completely ignored the government contracts already offshore outsourced and insourced.
The obvious "stimulus" was to simply cancel those contracts and bring them back here, hire Americans. you didn't even have to increase spending to do that. Notice how that idea never hits the national dialog? I mean 'shovel ready projects'
...gee, how long does it take to set up a call center here and train people to read scripts? (many support centers for food stamps, they offshore outsourced those jobs, as an example).
Data sources
Added the CPS query title headings and the formula for determoming "growth"
Clarified section on illegal immgration and visa overstays.
Linked to my blog for H-1B oversubscription -- couple pages of source material there. This post alreay getting very busy with sources in the footer,
thanks
This site, the only credibility we have is accuracy, citations, and you are writing in areas that the "spin is in", intensively so.
H1-B
The fact that new H1-B immigrants were hired to fill over half of the IT jobs over the last few years is a clear indication of US corporate intent to lower wages in that sector, and an indication of how US corporations have bought legislative influence. No doubt but that this pattern is repeated in other high paying industries. The recent Supreme Court decision allowing for corporate purchase of the government just makes it a done deal.
timely post, the lobbyists are out in force
The offshore outsourcing/global labor arbitrage/H-1B/L-1 lobbyists are out in full force, busy attacking EPI and putting up their fictional snow as "proof". That's the problem with white papers, hardly anyone reads them! It takes time to read these things and realize major statistical flaws, it's almost the same technique as derivatives. Few can follow and then give up, think something is valid and it takes some serious digging to see the flaws.
I believe lobbyists snow Congress with these things but they put together one page bullet point marketing glossies with their "summaries". Because few read the actual white papers, much less realize the faulty data and methods...wala, the lie is implanted!
That's why we need sites like EP, where we are not being paid to spin lies, we have no other motivation except to point out the lies of others. We don't have anything on the line (besides our day jobs).
Junk science
A lot of the junk science in the labor market is coming from the National Foundation for American Policy (NFAP). The inferences, carefully worded and presented by the NFAP are misquoted in other publications and then paraphrased in the media until "inferences" are presented as fact. The NFAP did a study on vacancies in major U.S. companies, I took a little time to look at these numbers objectively and found that the NFAP was crying wolf about an overall vacancy rate of 2.27%
http://1.bp.blogspot.com/_5X8jR7YAvj0/R-_OewTgncI/AAAAAAAAALs/A6oS9hxp4YI/s1600-h/NFAP_Debunk.jpg
Here's a snip from an NFAP press release, notice the careful use of the terms, "believed", "thought" and "potentially".
Fifty-two percent of companies believed that for every H-1B professional they hired it created one or more complementary jobs at their firms or in the U.S. economy. Twenty-two percent thought the hiring of an H-1B visa holder created 10 or more jobs. Seventy-four percent of company respondents said an inability to fill positions because of the lack of H-1B visas has potentially affected their “company’s competitiveness against foreign competitors or in international markets.”
http://www.nfap.com/pdf/080311pr.pdf
lobbyists plus
Right I think that's a lobbyist of one, bought and paid for. I think they also assume people will just believe them instead of reading their economic fiction.
Weaver, please format your links and display the images by properly formatting them. There is a user guide on the right hand column to help with any formatting issues.
Please do not post raw URLs/links, and never in a a post, almost never in a comment. Thanks.
Raw links
Fixed the raw links in the post -- guess I'm old school -- I like to see the published link match up with the destination in my browser before I click.
try the mouse hover
to see the link underneath. SEO and any publishers require posts be professionally formatted or they will not parse and index them. Same with graphs, they need to be visible, easily readable.