
July New Residential Single Family Home Sales increased by 3.6%, or 372,000 annualized sales. June's single family new home sales were significantly revised up, from -8.4% to -3.6%. The July monthly percentage change has a ±14.1% error margin and this is why we see large revisions to this report constantly. In other words, don't get too attached to the monthly percentage changes for odds are they will be revised.
New single family home sales are now 25.3% above July 2011 levels, but this figure has a ±18.2% margin of error. A year ago new home sales were 297,000. Sales figures are annualized and represent what the yearly volume would be if just that month's rate were applied to the entire year. These figures are seasonally adjusted as well.

The Census claims the Northeast region July new home sales skyrocketed 76.5% in a month. For the same Northeast region, last month's statistical release reported sales plunged -60.0%. That figure has since been revised to a -55.3% decline. While both monthly percentage changes look absurd, it's more a matter of such low sales volume. Minor variations in monthly sales become whopping percentage changes. This month's Northeast reported sales have a ±145.9% error margin, which tells you to not take to heart the figures.
The current supply of new homes on the market would now take 4.6 months to sell, a -4.2% decrease from June's 4.8 months worth of inventories. The amount of new homes for sale was 142,000 units, annualized and seasonally adjusted. From a year ago housing inventory has declined -31.3%. These is a record low in the supply of new homes for sale, as shown in the below graph.

Below is a graph of the months it would take to sell the new homes on the market at each month's sales rate. We can see these inventories vs. sales times have dropped dramatically from a year ago.

The median time a house was on the market before it sold was 8.7 months, an 8.8% increase from last month.

July's average home sale price was $263,200 and dropped -1.4% from last month's $266,900 average price.

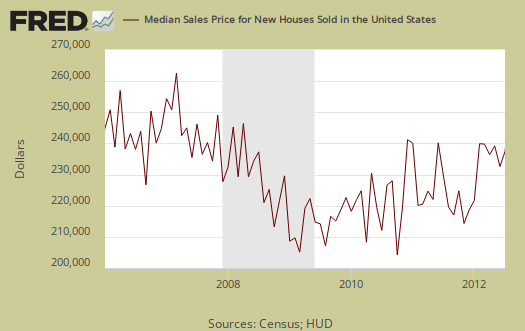
July's median price was $224,200, whereas June's median price was $229,100, a -2.2% monthly decline. Median means half of new homes were sold below this price and both the average and median sales price for single family homes is not seasonally adjusted.
The variance in monthly housing sales statistics is so large, in part, due to the actual volume declining. One needs to look at least a quarter to get a real feel for new home sales, but a year of sales data is more in order. Additionally this report, due to it's huge margin of error, is almost always revised significantly the next month. Buyer beware on month to month comparisons.
What we can say about new homes sales is a bottom does seem to have been hit for the change from a year ago, 25.3% is outside the margin of error of ±18.2%. We caution about going hysterical on monthly numbers for new home sales are often significantly revised and sales volume after the housing bubble burst is low. We list the margins of error for they are usually above the monthly reported percentage changes.
Here is last month's new home sales overview, only graphs revised.
Recent comments