
It's a conspiracy! The BLS is trying to swing the election! They're cookin' de books! By now you've seen the claims, accusations and mumblings by the pundits, press, twitter and blogosphere. So what really happened with this month's unemployment report?
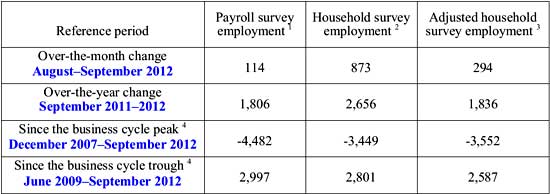
First the statistics. The BLS employment situation report actually is actually two separate surveys and this month the two really diverged. The CES or payrolls survey from businesses shows little payrolls growth, 114,000 jobs added, while the household survey, known as CPS, shows an impossible gain of 873,000 more employed people and a monthly drop of -456,000 in those officially unemployed. The unemployment rate dropped from 8.1% to 7.8% with literally not enough payrolls added to keep up with population. Graphed below is the official unemployment rate.

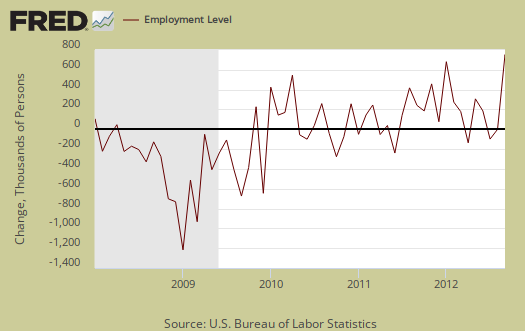
The CPS says the number of employed increased an astounding 873,000 in a month to a total of 142,974,000 employed people in the U.S. This is the largest change in employed that were not simply population statistical adjustments since March 2009, when the monthly change was -906,000. If one wants to only look at positive values, we need to go back to June 1983, where the employed increased by 991,000 to see that high of a monthly household survey employed growth. Below is a graph and you can see the outrageous jump.

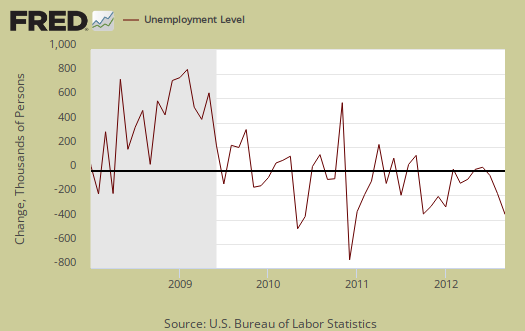
Somehow those unemployed dropped by a whopping -456,000 to a new level of 12,088,000. Below is the change in unemployed.
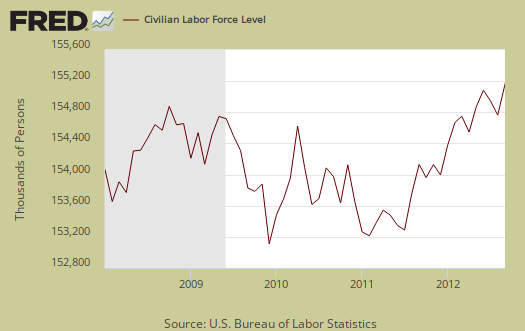
The civilian labor force also jumped up by 418,000 to 155,063,000.
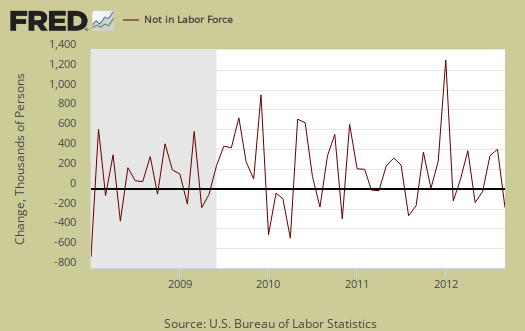
Those not in the labor force shrunk by -211,000 to 88,710,000.
How can that be? How can in one month 873,000 people magically become employed when the job market is so pathetic and our GDP growth is barely treading water?
One critical fact we need to know is the margins of error for the two surveys iare different. The CPS has a ±436,000 monthly error ratio in employed, whereas the CES error margin is ±90,900. Ok, that's still not enough to explain the other 437,000 people being counted as employed in a month, not accounted for in the standard margin of error...or is it?
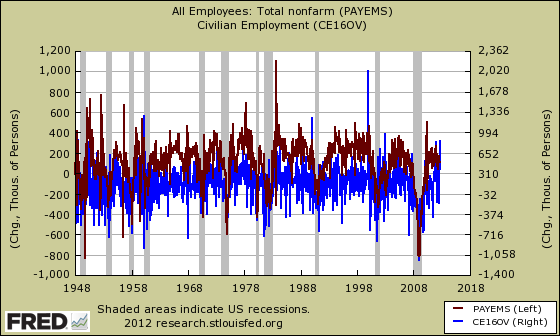
In under the hood of the employment report, we describe the differences between the two BLS employment statistic surveys. What you need to know at the moment is the CES and CPS are not the same and cannot be mixed! Additionally, there are annual population controls which throw a monkey wrench in the monthly statistics which we discuss here and here. To show you cannot directly compare the two surveys, we show the household employed along with the nonfarm payrolls in the below graph and notice these series go all the way back to 1948. As you can see, they are completely different, ain't the same statistical animal, as beastly as that is to the general public.

Is there anyway to compare the payrolls survey against the household survey? Why yes there is! The BLS does one better and releases monthly details on the differences between the CPS and CES surveys, along with fudge factors to smooth the variance. They give us a smoothed and adjusted series based off of the monthly household survey so we can compare it against actual payrolls. This month, after being adjusted, the household survey gives 294,000 jobs. This is still way off from the actual reported 114,000 job growth in payrolls. This 294,000 figure is also outside the margin of error of ±90,900 by 89,100 additional jobs. Below is a graph of the derived payrolls from the household survey that the BLS creates against the actual payrolls reported each month.
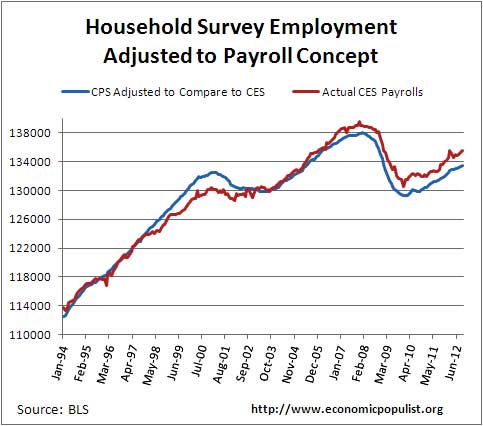
As we can see there is variance between the two, even after making adjustments to the CPS employed so we can directly compare it against monthly payrolls. Below is the raw total difference between the adjusted household survey against actual payrolls, on a monthly basis.
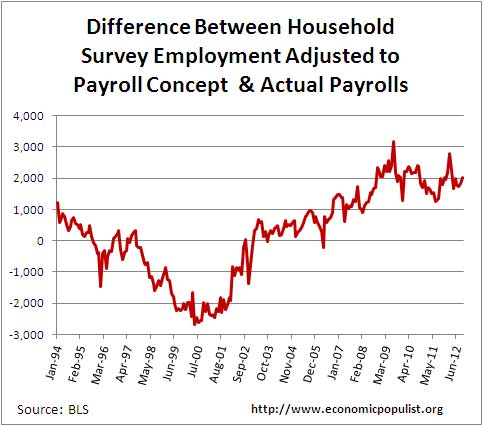
As we can see from the above graph, that difference has been increasing. Even with the household survey adjusted, it is still reporting a higher number of jobs than the CES payrolls survey indicates are really there. The difference for September was 2.007 million between the adjusted CPS versus actual payroll jobs.
Below is the monthly percentage difference between the smoothed and adjusted household survey of reported jobs versus the actual CES nonfarm payrolls reported.
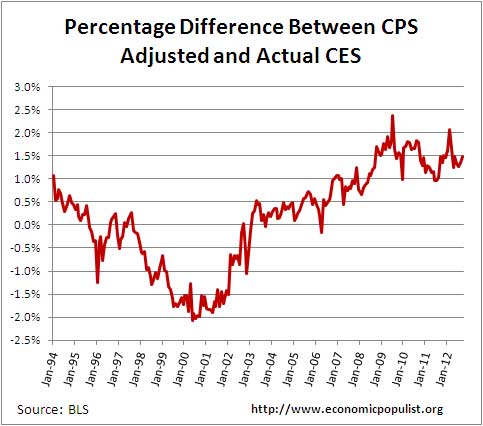
For September the percentage difference between the adjusted CPS against actual payrolls was 1.48%. Now as we can see that isn't that unusual, but as a trend we can see the household survey diverging from the payrolls survey, even when accounting for jobs the household survey captures which the establishment survey does not. Here is what the BLS does to create the adjusted CPS employed series graphed above:
The adjusted household survey employment series is calculated by subtracting from total employment agriculture and related employment, nonagricultural self employed, unpaid family and private household workers, and workers absent without pay from their jobs, and then adding nonagricultural wage and salary multiple jobholders. The resulting series is then seasonally adjusted.
Getting back to the question of how could there possibly be only 114,000 payroll jobs and a whopping 873,000 more employed, right before the election, without claiming the BLS is cooking the books has to be answered. We see that even when adjusting the household survey to be comparable against actual payrolls reported we're outside the margin of error and cannot account for 89,100 jobs. Yet, notice how the difference between the two, even when adjusted, is changing and more and more the two are diverging in the above difference graph.
In fact the average monthly difference if one takes the month all the way back to 1990 is 1,402,073 whereas if one goes back to 2005, the average difference between the adjusted CPS against the CES is 1,525,185. This 123,112 difference alone can start to account for the additional 89,100 jobs outside the margin of error, even after adjusting the CPS to compare against actual payrolls.
In other words, we have way too much statistical error and assumption fudge going on in the household survey to even take seriously the monthly changes. To wit, below is the monthly change in payrolls against the monthly change in household survey going all the way back to 1948. As we can see, this isn't the first time we had a wild hair reported on the monthly employment report. Now most of the wild spikes in the below graph are population controls but this report certainly isn't the first time payrolls and the household survey have wildly diverged.
To really try to remove statistical and survey error it's better to compare the change in job and employed from one year ago. The year over year change between the adjusted household survey for jobs is 1,836,000 yet actual payrolls shows 1,806,000 jobs gained over the past year. Yet it is actual CES payrolls which shows more job gains from the Great Recession low point than the adjusted household survey.
What does all of this mean? Well, for one thing, if you want any accuracy, look at the CES, the nonfarm payrolls survey. The CPS is a monthly survey of 60,000 households whereas the CES is a monthly survey of 141,000 businesses and government agencies. The CPS has to statistically extrapolate to cover the entire United States population and relies heavily on Census data, such as population adjustments. The CES, on the other hand, covers 486,000 establishments which provide employment and the survey results are what these businesses report as growth in their payrolls.
Additionally the CPS survey is a phone call asking regular people questions. The CES is a paper survey which asks businesses what their payrolls are and probably filled out by the person keeping the business books. Which survey method do you think would be more reliable for accuracy, just from the raw data collected?
We'll have more deep analysis on why we got this crazy monthly report but the above should at least demonstrate such wild swings in the CPS are not that unusual and bottom line, if you want to look at monthly employment statistics, you should stick with the nonfarm payrolls survey.
The BLS does't cook their books and this isn't an October election surprise. That doesn't mean we shouldn't get our juices going over piss poor monthly labor force statistics. What we need are much better raw data collection methods, much larger survey sizes, additional raw data points, such as immigration status and better correlation to other labor data sources, such as W-2s and IRS tax data. The blame for that one is actually on Congress. They are the ones who fund the BLS and the Census and clearly raw data collection needs to be brought into the modern era and guess what, that costs money. Think about it, if the Census bugs you on the phone to answer a bunch of questions about your job life, are you going to be perfectly honest or even talk to them? Are you gonna grab all of your detailed financial information and accurately write it all down for a Census taker, even with some fava beans and a nice Chianti? I didn't think so.
Yeah, over 800K 'stay at home" jobs suddenly are found..
So, you're concern about unemployment isn't quite what you claim it is, if it comes to protecting the outsourcer in chief, Obama.
over the outsourcer in chief Romney?
Again, this site is all economics and I'm not protecting anyone, just analyzing the monthly BLS report as I do every month, point out the problems with the employment report and overview, analyze the results. If one notices, we are a huge provider of economic eye candy. (Thanks FRED!)
Being accurate and objective precludes spinning numbers for a political agenda. Our number one rule around here is no economic fiction.
This ain't a butter churn for any politician or party, we're all about the numbers although we write about policy, legislation and Congressional hearings related to the economy often.
We do believe in Populist rants, emotion and outrage, also sarcasm and gallows humor, but the facts, statistics must be accurate and cited.
One of our jobs, which I hope we succeed at, is to bridge from advanced statistical methods, data, concepts to what they mean, are those numbers to be trusted, and what are the implications. Our job is to translate numbers into meaning.
But there seems to be a pattern where when people either don't have the background or simply go "brain dead" when they see a number, to instead throw out wild hairs. We're doing our best to get that part of the brain which digests numbers to wake up out of it's coma and see what we see.
So, in other words, when one has a wild ride statistical report, it's better to figure out why, from the numbers, than run around accusing people of being in violation of scientific methods and objectivity.