
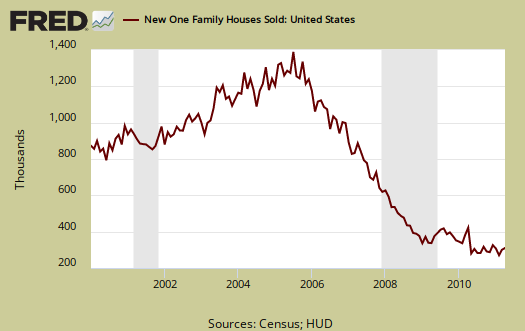
In April, New Residential Single Family Home Sales increased 7.3% from March's 8.5% increase, or 301,000 homes, with a April annual sale rate of 323,000 new homes. This is a -23.1% drop from a year ago. In April 2010, new home sales were 420,000.
These numbers are seasonally adjusted, but also with large error margins, and weather can influence sales. For example, the error window for the monthly percentage change is ±16.6%. Also, the seasonally adjusted rates from January 2009 until now were revised.
The supply of new homes is now at 6.5 months of inventory, quite a drop, -9.7%, from last month's 7.2 months of inventory. The number of new homes were for sale in April was the 175,000, March revised to 180,000.
Prices increased, with the April median price being $217,900 and the average price was $268,900. March's median price was $214,500 and the average price was $250,000.
The median time new homes were for sale was 8.8 months; March was 8.7 months.
Calculated Risk gives more analysis. While the headlines sound great, Calculated Risk found, by using not seasonally adjusted data, April was another record low in fact.
In April 2011 (red column), 32 thousand new homes were sold (NSA). This ties the record low for the month of April.
The record low for April was 32 thousand in both 1982 and 2009 - and now 2011. The high was 116 thousand in 2005.
Although above the consensus forecast of 300 thousand, this ties the record low for April - and new home sales have averaged only 298 thousand SAAR over the last 12 months ... moving sideways at a very low level.
So, take this report with a caveat of a large error margin, plus U.S. Department of Commerce did revise the seasonal adjustments. Calculated Risk understands seasonal adjustments, and comparing year to year is valid.
Here is March's report overview, not revised.
Recent comments