
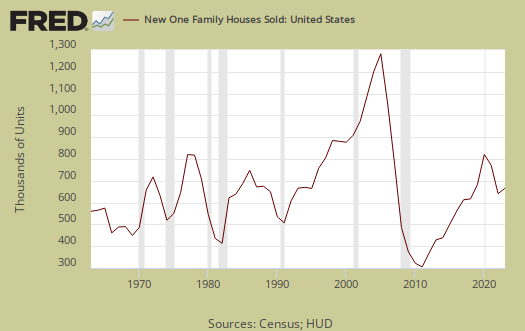
In February, New Residential Single Family Home Sales decreased by -1.6%, or 313,000 annualized sales. This report has a ±23.9% error margin. January single family home sales were significantly revised, from 321,000, an originally reported -0.9% annualized monthly change to 318,000 new homes, a -5.4% change from December.
New single family home sales are now 11.4% above February 2011 levels. A year ago new home sales were 281,000. Sales figures are annualized and represent what the yearly volume would be if just that month's rate were applied to the entire year.

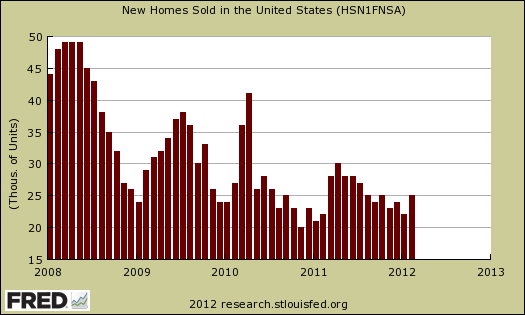
Quarterly and annual New Home Sales statistics were also released. Below is a graph for 2011 annual new home sales, 302,000 units. As we can see single family new home sales were D.O.A. for 2011.
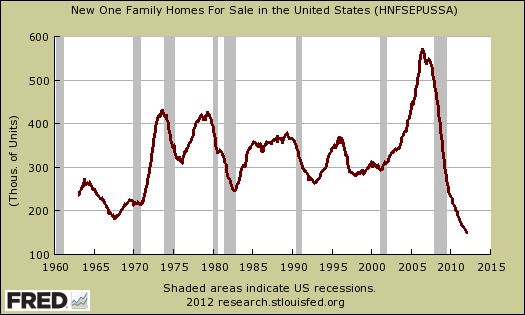
The supply of new homes for sale, are now at 5.8 months, assuming current sales rates. The amount of new homes for sale was 150,000 units, annualized and seasonally adjusted. This is the lowest amount of single family new homes for sale ever, as shown in the below graph. Simply put, watch out for falling housing bottom calls from the press hitting you in the pocketbook.
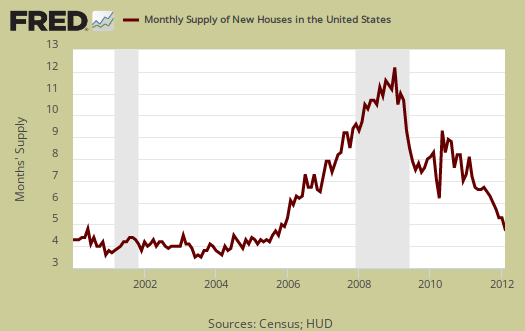
Below is a graph of the months to sell new homes on the market at each month's sales rate. We can see these inventories vs. sales times have dropped dramatically, but at still at housing crash bubble time levels to sell them all.
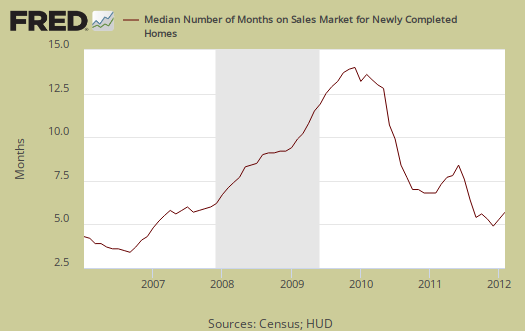
The median time a house was for sale increased to 7.6 months from 7.3 months. Below is a graph of the median time it took to sell the homes sold in February.
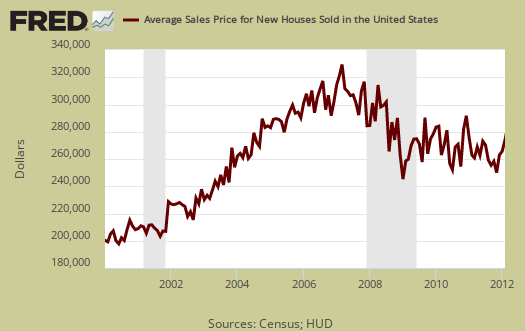
February's average price was $267,700. January's average new home price was revised down, from $264,900 to $261,900. November 2003 the average single family new home price was $268,300. The average home price is around early 2004 levels and simply has not come down enough to meet that new normal of low wages for most of America. Homes above $750,000 didn't register sales for the last two months.
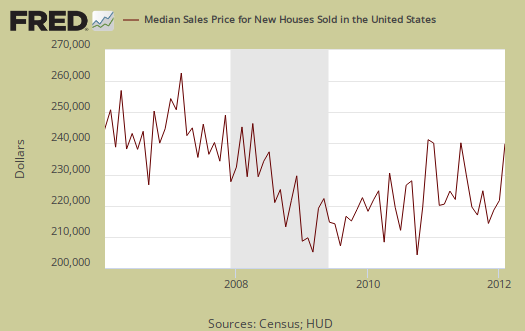
February's the median price was $233,700, whereas January's median price was $215,700. Median means half of new homes were sold below this price.
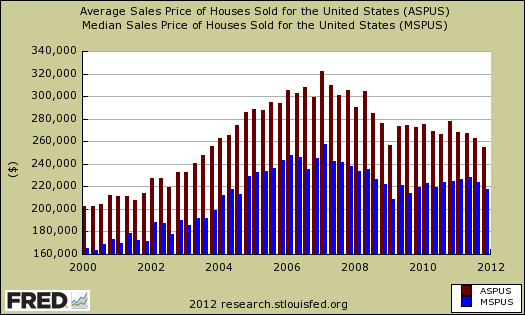
If one looks at median and average sales prices, they are still out of alignment with wages and salaries, which are flat for over a decade, even with record low mortgage rates. Below is a graph, quarterly, of new home sales average price (dark red) and median price (purple) since 2000. We can see there is still bubble in home prices.
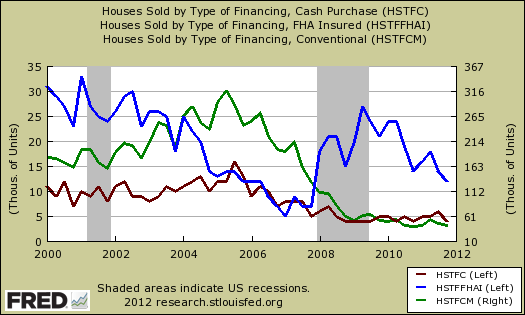
Most interesting is the below graph of new home sales by type of financing. The scale on the left is for cash and FHA insured financing, on the right conventional loans. What we see is cash sales (dark red line) have become almost non-existent, with FHA loans (blue line) taking up the slack. Most home loans are conventional (green line), as one can see by the differences between the left and right scales on the graph.
The variance in monthly housing sales statistics is so large, all one can say is the volume in new home sales seems to have stabilized to the new normal, of record lows, and inventories are returning to normal, which implies the new homes market has adjusted to the new normal or rolling around in the bottom. We hate the phrase new normal. Seriously, one can see by volume, the amount of new homes sold has dropped off a cliff. The result of a much smaller data pool is larger amounts of error. The raw number, not seasonally adjusted or annualized new homes sold in February was 25,000.
Additionally, some, clearly wanting the housing market to recover, are claiming this report is all a big fat lie. That one should report the not seasonally adjusted raw numbers and claim new home sales increased on a month-to-month basis as well as a year-to-year one. While this is true for the raw numbers, the same is true for the entire pattern of not seasonally adjusted new home sales going back years and why one can adjust for seasonal cyclical variance and still be accurate. See the graph below, every year, new home sales, not seasonally adjusted increase from that cold, dead of winter January. The improvement from one year ago is already accounted for in the seasonal adjusted 11.4% increase. Since seasons are cyclical (hello summer, fall, winter and spring), the comparisons to one year ago are usually more valid and the change from one year ago does show improvement. Bottom line, don't go gun crazy over these monthly reports, they will be revised.
Calculated Risk is a fantastic analysis site on housing data and compares new home sales to recessionary periods and goes back to 1963 in data comparisons.
Hilarious!
We just reviewed some of the MSM press on new home sales. Good god, this is the reason we overview these reports. Reuters is trying to claim this report shows recovery. No, sorry, it does not really. They point to a rise in median price and that is absurd for median price is very statistically noisy, one at least should take quarterly numbers and a history.
The press and vested interests want to manufacture a housing recovery so badly it's like they are seeing things!
Here at The Economic Populist stick with the data. We'll tell ya straight as best as we can determine, from the statistics themselves.
Correcting link to "new home sales"
Thanks for link to Calculated Risk, a great website, but the link for "new home sales" is to a .coml [sic] page!
I think what we want is --
CalculatedRiskBlog: New Home Sales Decline in February (23 March 2012)
Two miscellaneous comments --
1. IMO, what probably is happening is that some families are building additions and remodeling -- taking advantage of what's perceived as relatively low construction costs (still at least $100/sf) and also possibly staying put simply because there's no liquidity. That could definitely be considered a "new normal," compared to the "old normal" of people trading out of the old place and into a new one (new and larger), 'profit-taking' on the old place while avoiding paying income taxes on the gain (under the IRS rules for sales after two years or more). When it's a move in the other direction, i.e., downsizing (as with 'empty-nesters'), it seems that people now are often thinking in terms of keeping the old (larger) place as a rental while taking out a conventional mortgage on the new smaller place (probably not new construction), based on downs of maybe 30% or more. It's remarkable how little we hear of places sold on contract, which was a very common practice back in the 1970s and 1980s (usually at 10% annual interest).
2. I hear talk of tax assessors in some areas/states are tending toward replacement cost rather than market value. Seems likely there's a big disparity between the two. Cost per sf are mostly about $100 (although Oregon is $115, California is about $130) ... so just a 2000-sf new place -- after adding in costs of lot, excavation, foundation, permits, etc. -- that's like a minimum almost anywhere of about $300,000 (at least $250,000). You can probably buy comparable although 'used' for $100,000 less. Why build?
Interesting webpage for costs per sf (with an applet) --
www.home-cost.com/construction-cost-per-sf.html
link corrected, thanks
These are templates which I use each month, else I would have to re-create all of these graphs instead of updating the base ones and adding. CR is great and it's pretty rare when I disagree with him generally (although I have), but I like him because he's extremely data centric, knows macro economics, knows how to analyze from 1st principles.
This report is just full bore new homes, single family, so it does not have any home equity, home revisions and so on.
Same with existing sales (which I skipped this month because I plain got locked over over 4 days total, Internet down for the entire region), but in the January overviews I think we said "wishful thinking, guess what gang, it's warm weather" or something to that effect.
I could say residential real estate has stopped it's grand collapse but I just have a hard time believing home prices will not go significantly lower simply because the middle class is wiped out. We're all poor and something thinking importing a bunch of foreigners to "buy up house" is really smoking some of that funky pipe dream weed.
While "not" with Bernanke on things like quantitative easing, lately his assessment of where the economy is, macro wise, to me seems dead on.