
The December 2016 S&P Case Shiller home price index shows a seasonally adjusted 5.6% price increase from a year ago for the 20 metropolitan housing markets and a 4.9% yearly price increase in the top 10 housing markets. Both Seattle and Portland's annual home price gain exceeded 10%. Home prices are still climbing and nationally exceeded their 2006 housing bubble peak. The U.S. National Home Price Index has also increased 5.8% from a year ago and continues at a 30 month high. From the 2006 price peak, the national index, covering all nine geographic divisions, has increased 0.5%. Since the price low of March 2012, the 10-City composite index has increased 41.0% and the 20-City composite index has increased 43.7%. S&P is wondering if housing is in another bubble or if these prices are sustainable.
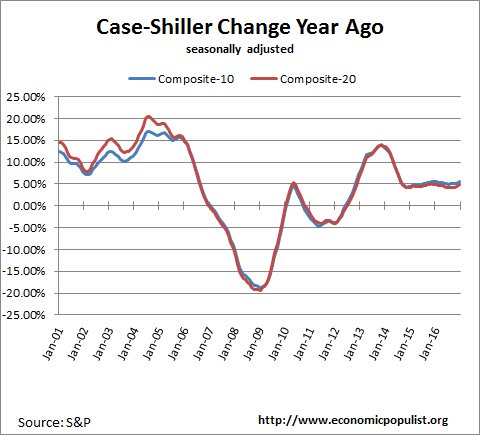
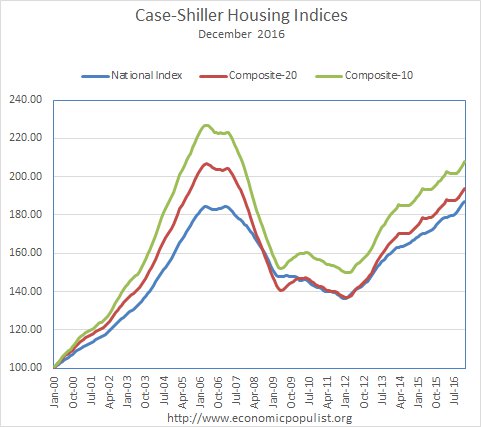
Prices are back to winter 2007 levels and once again unaffordable as wages and incomes have not similarly recovered. The housing bubble peak was in July and June 2006. Nationally, housing prices have surpassed that peak by 0.5%. The 20-city index is still -6.7% below and the 10-city index is -8.8% below their 2006 bubble peaks. We can only assume that America is back to being a debtor nation and we don't know how anyone is making their mortgage.
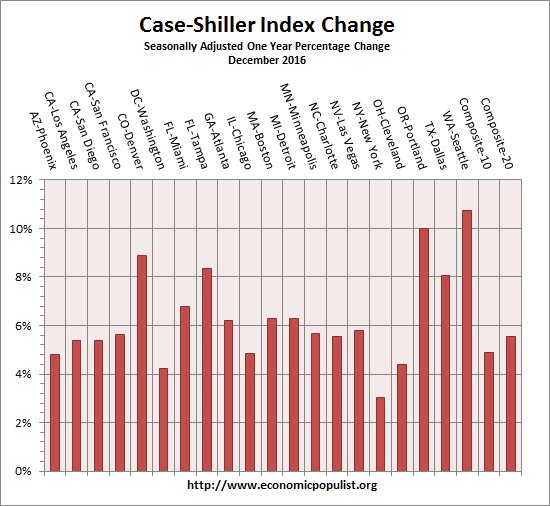
Below are all of the composite-20 index cities yearly price percentage change, using the seasonally adjusted data. The Northwest is on fire with Portland Oregon home prices increasing 10% and Seattle, Washington prices worse with a 10.8% annual increase. Denver Colorado prices increased over 8.9% from a year ago. Dallas Texas homes have also increased 8.1% in a year Tampa Florida has increased 8.4% from a year ago. This is so unattainable for most people, especially now with mortgage rates increasing.
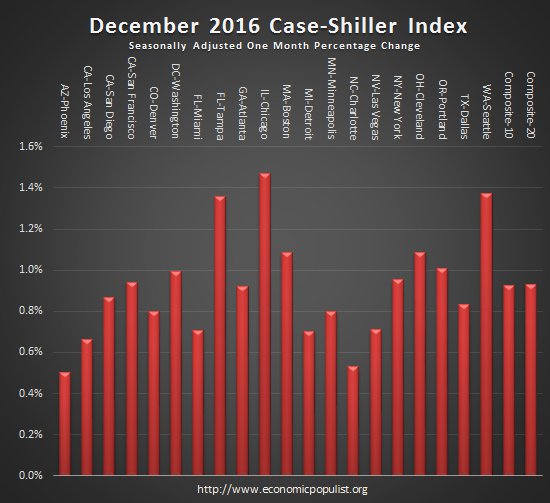
S&P reports the not seasonally adjusted data for their headlines, while this overview uses their seasonally adjusted metrics. For the month, the not seasonally adjusted composite-20 percentage change was 0.3% whereas the seasonally adjusted change for the composite-20 was 0.9%. The not seasonally adjusted composite-10 increased 0.3% from the previous month, whereas the seasonally adjusted composite-10 showed a 0.9% increase. The differences should be no surprise since December is the off-season for home sales. The below graph shows the seasonally adjusted monthly percentage change. Housing is highly cyclical. Spring and early Summer are when most sales occur at higher prices we might add.
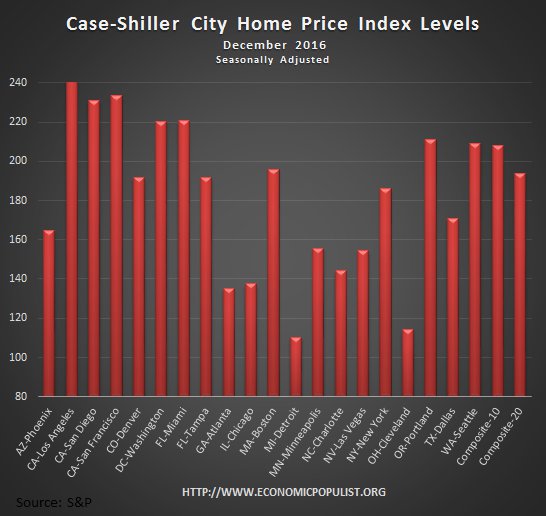
Case-Shiller home price indices are normalized to the year 2000. The index value of 150 means single family housing prices have appreciated, or increased 50% since 2000 in that particular region. Case-Shiller indices are not adjusted for inflation. Below are the seasonally adjusted levels for the month.
S&P is really commenting and this report focused in on Seattle and Portland, with the conclusion their on fire soaring prices were normal. We reprint their entire analysis since this month it seems to be fairly insightful and also adjusts for inflation. From the report:
Home prices continue to advance, with the national average rising faster than at any time in the last two-and-a-half years,” says David M. Blitzer, Managing Director and Chairman of the Index Committee at S&P Dow Jones Indices. “With all 20 cities seeing prices rise over the last year, questions about whether this is a normal housing market or if prices could be heading for a fall are natural. In comparing current home price movements to history, it is necessary to adjust for inflation. Consumer prices are higher today than 20 or 30 years ago, while the inflation rate is lower. Looking at real or inflation- adjusted home prices based on the S&P CoreLogic Case-Shiller National Index and the Consumer Price Index, the annual increase in home prices is currently 3.8%. Since 1975, the average pace is 1.3%; about two-thirds of the time, the rate is between -4% and +7%. Home prices are rising, but the speed is not alarming..
One factor behind rising home prices is low inventory. While sales of existing single family homes passed five million units at annual rates in January, the highest since 2007, the inventory of homes for sales remains quite low with a 3.6 month supply. New home sales at 555,000 in 2016 are up from recent years but remain below the average pace of 700,000 per year since 1990. Another factor supporting rising home prices is mortgage rates. A 30-year fixed rate mortgage today is 4.2% compared to the 6.4% average since 1990. Another indicator that home price levels are normal can be seen in the charts of Seattle and Portland OR. In the boom-bust of 2005-2009, prices of low, medium, and high-tier homes moved together, while in other periods, including now, the tiers experienced different patterns.
For more Information:
S&P does a great job of making the Case-Shiller data and details available for further information and analysis on their website.
Here is our Case-Shiller past overviews as well as the overviews of residential real estate statistics.
Recent comments