
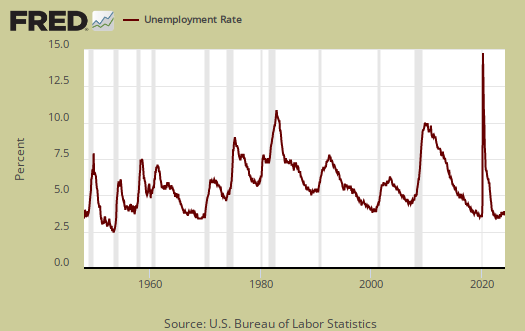
January is the month when annual adjustments are added to the unemployment report. These adjustments are just tacked onto the month of January, hence one cannot compare the past month without removing these figures. Yet, with or without the annual adjustments, this year's end result isn't much of a shift. The January unemployment rate is 4.8%. Those employed had little change as did those unemployed. Even those dropping out of the labor force was not dramatic. The labor participation rate is now 62.9%, a still terrible figure and the employment to population ratio is also still low Folks, there just isn't much to write home about. On paper things look great, yet we all know there are millions underemployed and not working who should be.
This article overviews and graphs the statistics from the Employment report Household Survey also known as CPS, or current population survey. The CPS survey tells us about people employed, not employed, looking for work and not counted at all. The household survey has large swings on a monthly basis as well as a large margin of sampling error. This part of the employment report is not about actual jobs gained, as reported by businesses, but people and their labor status.
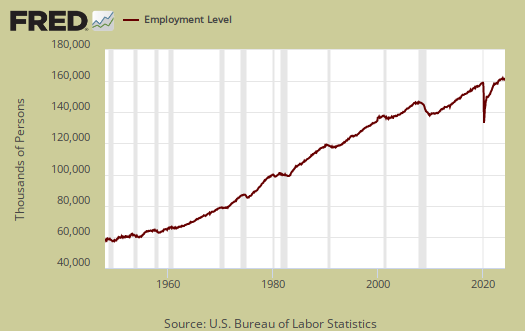
Those employed number 152,081,000. From a year ago, the ranks of the employed has increased by 1,548 million. The annual gain is now close to what is required to keep up with new population growth.
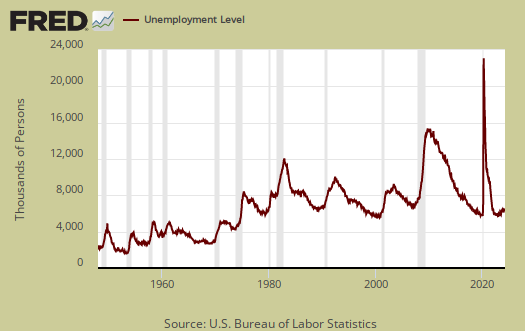
Those officially unemployed is 7,635,000. From a year ago the unemployed has decreased by −194,000.
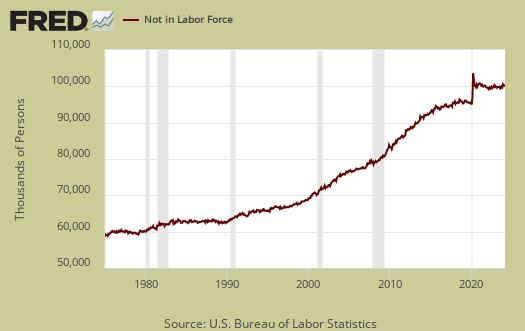
Those not in the labor force is 94,366 million. The below graph are the not in the labor force ranks. Those not in the labor force is almost unchanged from a year ago, a 330,000 increase.
The labor participation rate is 62.9%, which is still terrible Pre-recession, the January 2008 labor participate rate was 66.2% and one must remember the job market was not good pretty much after 9/11.

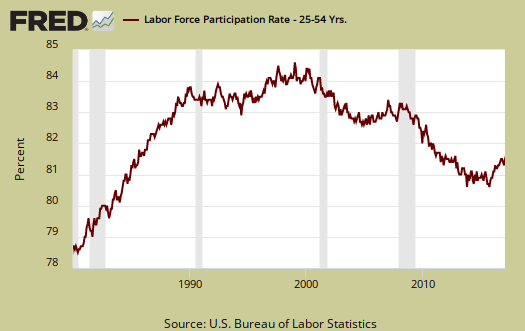
Below is a graph of the labor participation rate for those between the ages of 25 to 54. The rate is 81.5% which is pretty much static. Ages 25-54 are the prime working years where people are not in retirement or in school full time as commonly as other age groups. In January 2008 the prime working years labor participate rate was 83.3%.
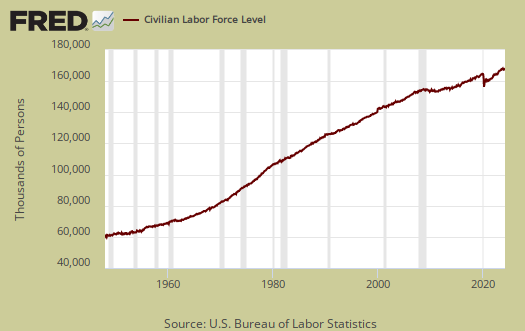
The civilian labor force, which consists of the employed and the officially unemployed is 159,716,000. The civilian labor force has grown by 1,354,000 over the past year. The BLS counts those on guest worker Visas and even illegal workers mixed in with permanent resident and citizen workers in their statistics.
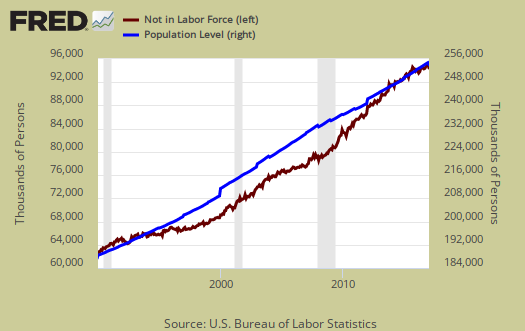
Below is a graph of those not in the labor force, (maroon, scale on the left), against the noninstitutional civilian population (blue, scale on the right). Notice how those not in the labor force crosses the noninstitutional civilian population in growth. The civilian noninstituitonal population is from where all other labor statistics have sprung.
Below is a graph of the civilian labor force, or the official employed plus unemployed, in maroon, scale on left, against those not in the labor force, in blue, scale on right. See how those not in the labor force as a trend exceeded those considered employed and unemployed starting around mid 2009. Starting in 2014 it has reverted back, yet it oscillates starting in 2015. To have a solid employment situation those not in the labor force should be growing less than those obtaining jobs and being counted as looking for work. Those not in the labor force does include retirees and students and there is a baby boomer bump in both of these population groups.

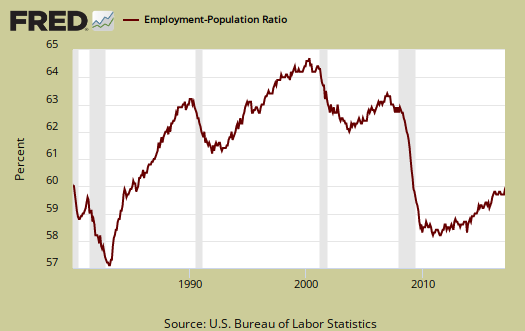
Those considered employed as a ratio to the total Civilian noninstitutional population is 59.9%. In January 2008, this figure was 62.9%. The relationship between the employment-population ratio and the labor participation rate (LPR) is: employment-population ratio = LPR * (1 - unemployment rate).
The BLS calculated what the monthly change would be if population controls were removed. We have no idea why the Census only does these adjustments annually and does not regressively distribute the change over a 12 month period, but they don't. The biggest shock is the civilian labor force would have increased 584,000 while those employed would have jjumped up by 457,000 and those not in the labor force would have decreased by -413,000. We're not taking too much stock in these swings and the thing to focus on is the annual change. With the population adjustments removed and thus nothing is adjusted for over a year, statistical swings are more wild. Here are our past overviews CPS unemployment statistics, only graphs revised.
Recent comments