
The BLS establishment survey doesn't get much press love or headline buzz when it comes to the monthly employment statistics, despite the survey's better accuracy than the population survey. For the past year, 1.899 million payroll jobs have been added and payrolls now stand at 132,821,000. From a year ago this is a 1.5% increase. The below pie chart breaks down March 2012 payrolls by major industry's percentage of total employment.
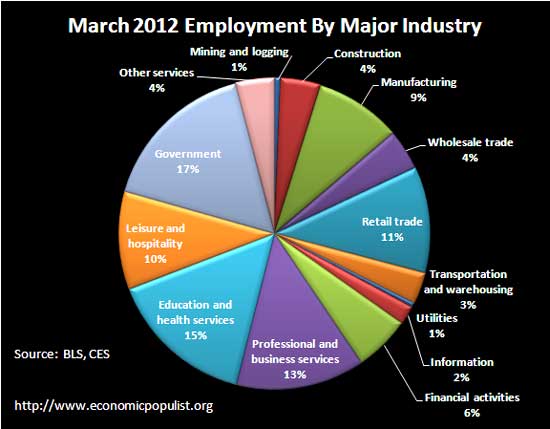
The above graph gives payroll jobs as reported by businesses and this report are jobs, not people working those jobs. This survey also lumps together part-time and full-time positions. Retail trade is 60% low paying sales clerks and such. Leisure & hospitality includes hotels, restaurants and bars. Government includes federal, state and focal government jobs. We see manufacturing is only 9% of total U.S. payrolls, when we would hope manufacturing, both durable and non-durable, would dominant the overall U.S. employment picture. Instead, government dominates.
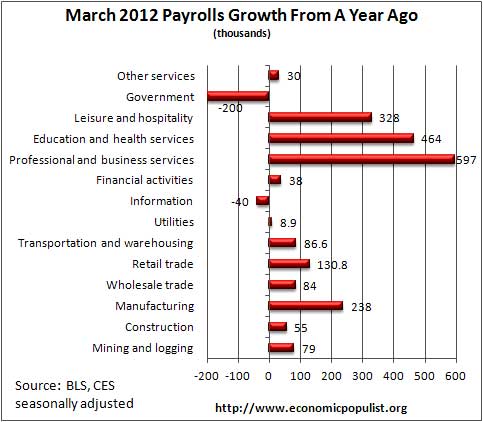
For the year, we have professional and business services showing the most growth by raw levels. The below graph shows the employment levels change from March 2011.
Certain major industry sectors simply have way less jobs than others, by their nature and size. When looking at jobs growth by percentages per industry, we see mining and logging increasing their payrolls by 10.4% for the year. This employment category includes petroleum, gas, and coal and the increase in this sector's employment is due to petroleum and natural gas. Frack!
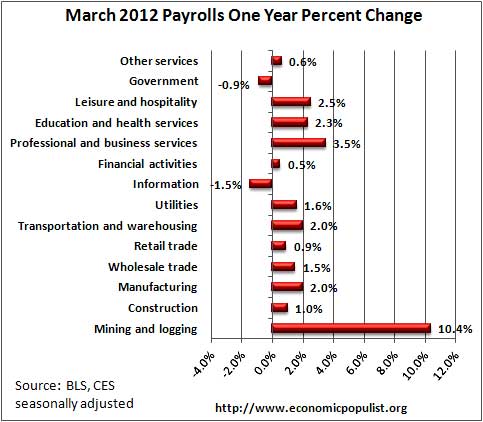
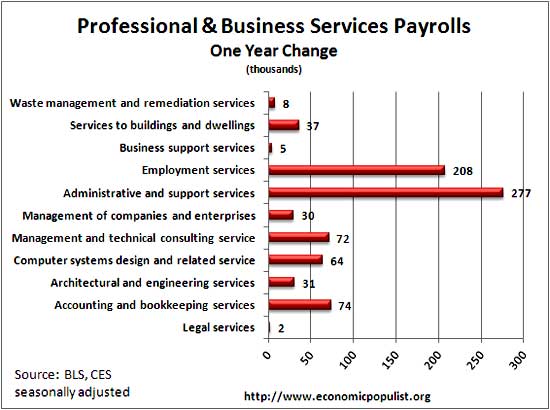
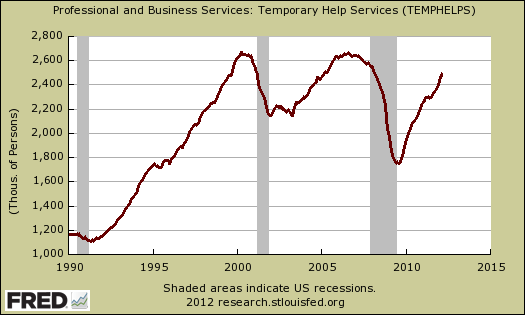
Professional & Business services employment also increased by 3.5%. While job growth in professional and business services sounds great, after all, professional sounds like some serious career juju, yet is this growth in high paying careers really? Below is a breakdown of the yearly job growth from the professional and business services category. Employment services include nasty creatures like Manpower and contract body shops, which take a percentage cut out of your pay. As we can, see the majority of growth is in administrative and support and employment services. Employment services are 89% temporary jobs and then the overseers who manage and place. them. Temporary jobs have increased by 184,600 since March 2011.
While bearing in mind population has increased over the last 20 years, the below graph shows a disturbing independent trend of temporary jobs.
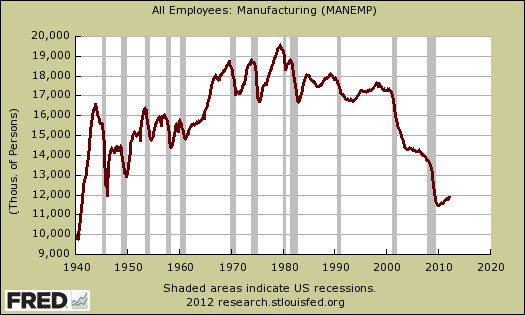
Bottom line the overall job growth from the past year, beyond petroleum and natural gas (mining) sorts of jobs, seems quite front loaded with low paying ones and this is in spite of manufacturing's job growth. Manufacturing is the one bright spot, but bear in mind manufacturing cliff dove during 2008. Below is a graph of manufacturing employment and one of my favorite graphs. While we see the upturn from the Great recession, look at the astounding decline of manufacturing employment in the United States. Now go shop at Walmart.
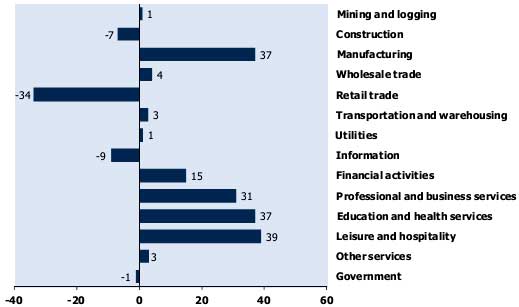
For March, the job growth by significance is bleak. The BLS gives a table, which ranks payrolls by significance in growth for the month. At the top of the list are food services and drinking places. Most jobs in restaurants and bars are low paying. In the top five we have administrative and support services, transportation equipment, ambulatory health care services and my favorite, credit intermediation and related activities. Below is the BLS graph for the March 2012 monthly change in major industry categories from the establishment survey.
March payrolls growth reads like the new American dream. One can work at fast food, push paperwork around, get taken to the emergency room after getting burned from french fry oil, and finally experience debt collectors ringing your phone non-stop for the $50k health care bill just racked up from the hospital visit.
The bright spot in March was transportation equipment. Those are U.S. manufacturing jobs and explains, in part, why manufacturing overall increased by 37,000 jobs.
There is another obscure table from the current establishment survey which shows the peak and trough of payrolls categories. For example, communications equipment's payrolls peak goes back all the way to 2000. So does motor vehicles and parts. May we suggest outsourcing seems to be appearing in these payroll peaks. Communications equipment manufacture was heavily offshore outsourced, including R&D, starting around that time. Another example is Plastics and rubber products, where employment also peaked in 2000.
We believe there is less focus on the establishment survey simply because there are so many industry payrolls categories and large tables of data. Still, beyond the time lagged occupational report, this is about as good as in gets for what types of jobs are really being created each month.
Comments
Government does not "dominate"
In many states, public sector jobs are basically gateways between public money and the private sector. They are the mechanism by which sunshine laws and open accountability are applied to private sector contracts that affect public works. And without those government jobs, and the contract oversight standards behind them, public money would be siphoned into private pockets with absolutely no fail safe.
Also, government jobs are what keeps a lot of smaller private companies alive. If it weren't for this symbiotic relationship, we'd have nothing left in public construction but, say, Halliburton doing whatever they feel like and vacuuming our pockets dry with no oversight.
government jobs
I believe the majority of government jobs and this is federal, state and local, are law enforcement, prison guards or a large part. My opinion injection isn't one of those 'shrink the government' or somehow government workers are not performing vital services unlike the private, more simply one of scale. In other words, a strong, humming, production economy should have much a much larger manufacturing sector.
jobs
In the U.S., Formal Education Beyond High School
IS Not Required for 66% of the 2008-2018 Job Openings
see page 15 of http://www.bls.gov/opub/ooq/2009/winter/art02.pdf.
The 2010 to 2010 report reported no measurable changes in numbers.