
The March 2012 monthly unemployment figures show the official unemployment rate dropped a 10th of a percentage point to 8.2%, and the total nonfarm payroll jobs gained was 120,000. These statistics are not the blow out most were hoping for. Total private jobs came in at 121,000. Government jobs dropped, -1,000. While manufacturing gained 37,000 jobs, retail trade, a category that includes retail sales clerks, dropped -33,800 jobs.

February's jobs were revised from 227,000 to 240,000. January payrolls were revised, down from 284,000 to 275,000. Below is a graph showing the monthly change in nonfarm payrolls employment.
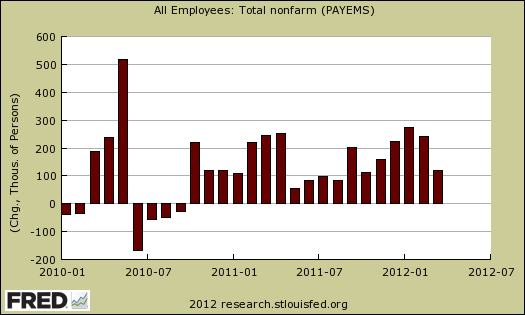
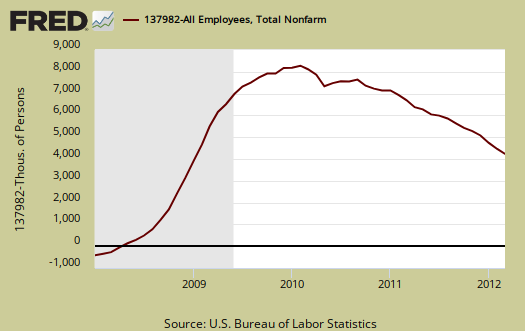
America has one hell of a payroll jobs deficit. The start of the great recession was declared by the NBER to be December 2007. By looking at the start of the great recession, we can calculate how many jobs we're still down from that fateful 2007 December. With the March payrolls growth, the United States is now down -5.161 million jobs.

Below is a running tally of how many official jobs permanently lost, from the establishment survey, since the official start of this past recession. Increased population growth, implies the United States needs to create at least 10 million jobs or self-employment, using the population survey statistics. This estimate assume a 62.7% civilian non-institutional population to employment ratio, as it was in December 2007. This implies an additional 4.9 million jobs were needed over a 51 month time period beyond the ones already lost. This is just taking into account increased population against the payroll jobs gap, the actual number of jobs needed is much higher, in part because payrolls, CES, and population, CPS, are two separate data surveys.
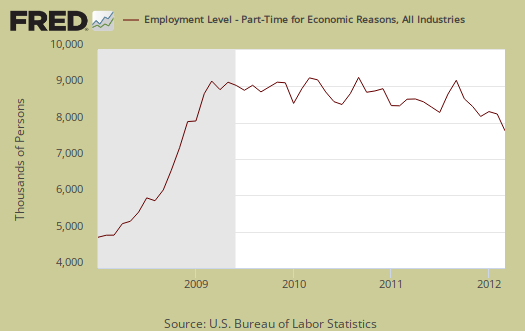
Another problem with the employment market is the gross number of part-time jobs generally at the huge number of people who need full-time jobs with benefits. Those forced in part time jobs dropped -447,000 in February, and this is one of the bright spots of this month's employment statistics. While payrolls looks like milk toast, that large of a drop in people forced into part-time work implies some moved to full-time hours. Of the 142.03 million employed as reported from the current population survey, there are still 7.7 million of the 26.2 million part-timers working low hours because they cannot get full time jobs. That's a hell of a lot of people stuck in part-time jobs who need full-time work, so almost a half a million drop in a month is a good sign.
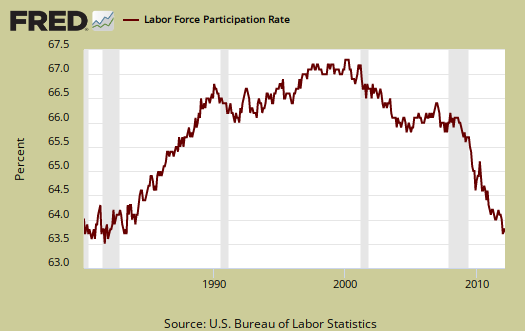
The labor participation rate, dropped a 10th of percentage points to 63.8%. If we go back to December 2007, the labor participation rate was 66%. The highest civilian labor participation rate was in January 2000, at 67.3%. What this means is there are over 5.34 million people not be accounted for in the official unemployment rate, in other words counted as employed or unemployed, who probably need a job and can't find one. That's in addition to the official 12.673 million unemployed.
The employment to population ratio is now 58.5%, at record lows and dropping a 10th of a percentage point from last month. You have to go back to the severe recession of 1983, October to find such low ratios. The low employment to population ratio clearly includes people dropping out of the labor count. we can see this by the cliff dive employment to population ratio during 2008-2010. There is no way magically, suddenly, a huge increase of population volunteered to drop out of the labor force, turned 65 at once, or magically all went to school. Remember that cliff dive in employment to population ratio represents about 10 million people. There is no way roughly 10 million people more people retired or went off to school in the space of two years as amplified by the drop in labor participation rates for those between ages 25-54, the prime working years.
These numbers are important because unemployment is a ratio, percentage or during a limited time period, the number of people actively looking for a job and counted. Many people are not counted in the official unemployment statistics, yet when looking behind the official numbers it's clear America has more potential workers and less jobs in so called recovery than during one of the worst post WWII recessions.

How did the U.S. only add 120,000 jobs yet the unemployment rate dropped? First, these are two separate surveys, the jobs number comes from the CES, or establishment survey where the unemployment ratios comes from a different survey, the CPS, otherwise known as the Household survey. The unemployment rate is a ratio of those officially unemployed to those officially counted as part of the labor force. Less people were considered part of the labor force in March. Those not in the labor force jumped by 333,000 while overall non-institutional population rose by 169,000. The civilian labor force decreased by -164,000, whereas those officially unemployed decreased by -133,000. Yet those officially employed also decreased by -31,000. In other words, people fell out of the official count.
We'll have more details overviewing this month's unemployment report in later posts, including looking at labor participation rates by age bracket.
For more information on how the BLS tabulates non-farm payroll jobs, see this article, Under the Hood of the Employment report.
Not good news
Retail jobs dropped almost 34,000 ???
That's bad news.
it is and that's from the CES, businesses report those numbers
I hope to make this "jobs report" weekend with more analysis coming. But the CES or establishment survey has more accuracy than the CPS survey and that's where those -34k of retail trade jobs is coming from. Since this is March, not a holiday season here, it's not clear yet where these losses came from. I think Sears and Best Buy closed a host of stores and I saw JCPenny was doing layoffs, but I don't know how much of the tally is due to layoffs, retail failures or if its systemic, across the sector yet. If it's just a few retailers bombing out because they cannot adjust, then it's a blip, but if it's across the board, it will imply a potential retail sales slowdown.
Oak, you're not serious, when
Oak, you're not serious, when state a 8.2% UE rate are you? I mean why would you publish that garbage, then offer no explanation as to reason for the bogus number and what the true U3 rate is (over 12%) I mean, please don't tell me you're spewing the garbage from the BLS and regurgitating it here. Who are you trying to pander to? What idiot moron drone would buy an 8.2%? I'm just trying to figure your agenda. What exactly is it. Who do you shill for? Or are just that ignorant.
get a life please
First, I don't "shill" for anyone. Second, if you bother to read these overviews, I many, many times calculate out the "real" employment rate, currently at about 18% and it's clear I amplify all of the BLS definitions so one knows people are left out of the official unemployment rate.
Every single month I pour over record low labor participation rates and go hunt to dig out the hidden unemployed and the underemployed.
I'm sorry, but we stick to the data, mathematics and from that basis, do show, every month, the piss poor state for American workers.
That said, when one UNDERSTANDS what the official unemployment rate is, it's a valid metric and also shows a piss poor labor market, by historical norms.
Try reading all of the report overviews instead of just wanting to slam someone, thanks. Just as it's completely irresponsible to claim unemployment is ok in America, it is just as irresponsible to not understand these reports and especially the limits of these BLS reports. I spend hours overviewing these facts, the least you could do is actually read them.
The crux of my point is, why
The crux of my point is, why print a headline that
says ..."8.2%-" YOU know that most drones out there
will not bother to read past the first paragraph.
They will see that 8.2% and spread the lies even further.
That is irresponsible.
Yes, I read the entire article, I just don't get why you would pander further to the deception, unwillingly as it appears. All you're doing in my opinion, is confusing the average person and adding to the misinformation.
Do you really think that the average reality-tv watching dope is going to read and decipher your article? Come on.
No matter how in-depth your research and analysis may be, you are creating fodder, whether you realize it or not.
Sure, a contingent of readers who are regulars here will get what you are saying, but in the broader picture, it is a dis-service to lead with a headline like that.
drones don't read even the 1st paragraph
Well, I can consider better titles. Just habit to start with the official numbers and go from there. But if someone is just reading titles, not good, that said, we have major press people who cannot understand the BLS report and publish garbage every month "reporting" on it.
But I can try to jazz up the titles on these overviews anyway to more reflect whatever meat on the missing I dig out from the report. Starting next Friday I'll look to write a meat content, catchy title instead of the official main stats.