
The February 2012 monthly unemployment figures show the official unemployment rate remained the same, 8.3%, and the total jobs gained were 227,000. While this report is good news, we've got a long, long way to go before returning to a healthy labor market. Total private jobs came in at 233,000. Government jobs dropped, -6,000. Most of the jobs were in the service sector, 209,000. Temporary jobs increased 42,500. Manufacturing gained a much needed 31,000 jobs.

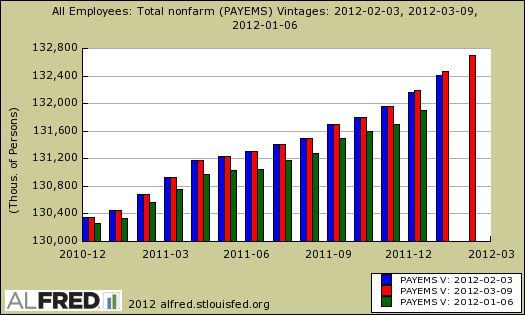
January payrolls were revised, from 243,000 to 284,000. Government jobs only lost -1,000 in January when it was originally reporting government jobs were down by -14,000. December was also revised upward by 20,000 jobs to 223,000 for the month. Below is a graph comparing payroll revisions versus their originally reported values for the last two months. In January, the 2010 Census plus benchmark revisions were incorporated.
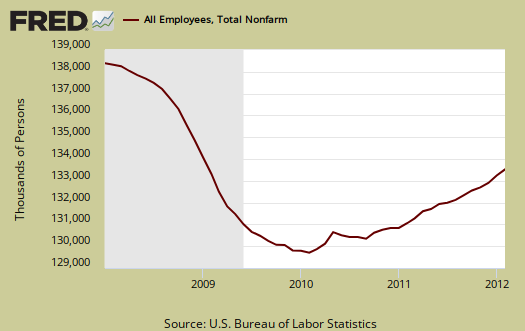
America is still running one hell of a payroll jobs deficit. The start of the great recession was declared by the NBER to be December 2007. By looking at the start of the great recession, we can calculate how many jobs we're still down from that fateful 2007 December. With the February payrolls growth, the United States is now down -5.285 million jobs.
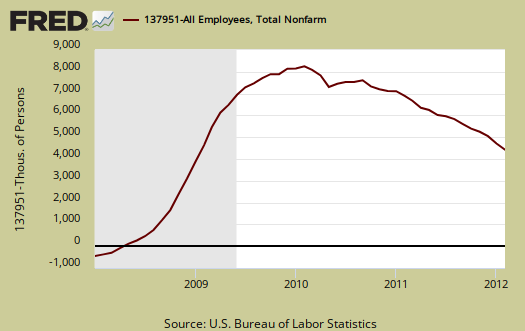
Below is a running tally of how many official jobs permanently lost since the official start of this past recession. Increased population growth, implies the United States needs to create at least 9.94 million jobs or self-employment. This estimate assume a 62.7% civilian non-institutional population to employment ratio, as it was in December 2007, which implies an additional 4.66 million jobs were needed over a 50 month time period beyond the ones already lost. This is just taking into account increased population against payrolls, the actual number of jobs needed is much higher.
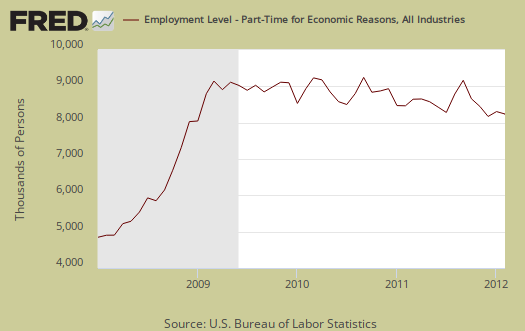
Another problem with the employment market is the gross number of part-time jobs generally at the huge number of people who need full-time jobs with benefits. While those forced in part time jobs dropped -111,000 in February, there are still 8.12 million of the 26.95 million part-timers working low hours because they cannot get full time jobs. That's a hell of a lot of people stuck in part-time jobs who need full-time work.
The labor participation rate, while still very low, ticked up 0.2 percentage points to 63.9%. If we go back to December 2007, the labor participation rate was 66%. The highest civilian labor participation rate was in January 2000, at 67.3%. What this means is there are over 5.1 million people not be accounted for in the official unemployment rate, in other words counted as employed or unemployed, who probably need a job and can't find one. That's in addition to the official 12.806 million unemployed.

The employment to population ratio is now 58.6%, finally ticking up one percentage point from last month. but still at record lows. You have to go back to the severe recession of 1983, October to find such low ratios. The low employment to population ratio clearly includes people dropping out of the labor count. we can see this by the cliff dive employment to population ratio during 2008-2010. There is no way magically, suddenly, a huge increase of population volunteered to drop out of the labor force, turned 65 at once, or magically all went to school. Remember that cliff dive in employment to population ratio represents about 10 million people. There is no way roughly 10 million people more people retired or went off to school in the space of two years.
These numbers are important because unemployment is a ratio, percentage or during a limited time period, the number of people actively looking for a job and counted. Many people are not counted in the official unemployment statistics, yet when looking behind the official numbers it's clear America has more potential workers and less jobs in so called recovery than during one of the worst post WWII recessions.

How did the U.S. add 247,000 jobs yet the unemployment rate remained the same? The unemployment rate is a ratio and more people entered the labor force. Those not in the labor force dropped by -310,000 while overall non-institutional population rose by 166,000. The civilian labor force increased by 476,000, whereas those officially unemployed only increased by 48,000. The people who re-entered the labor force, or the official count, pretty much all got jobs. That's good.
We'll have more details overviewing this month's unemployment report in later posts, including looking at labor participation rates by age bracket.
For more information on how the BLS tabulates non-farm payroll jobs, see this article, Under the Hood of the Employment report.
check back in a few hours for more details
We're late to the data party, but we actually read the reports and number crunch to make sure it's accurate. Lots of information to analyze and it takes a while. We'll have more details soon, I promise.