
The personal income & outlays BEA economic report for December 2010 is out. Personal Consumption Expenditures, or PCE, was already reported as part of the Q4 GDP report and had increased 4.4% for the quarter.
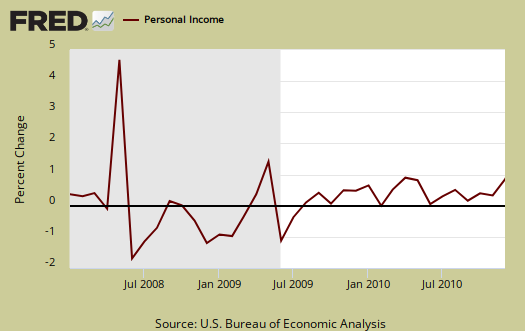
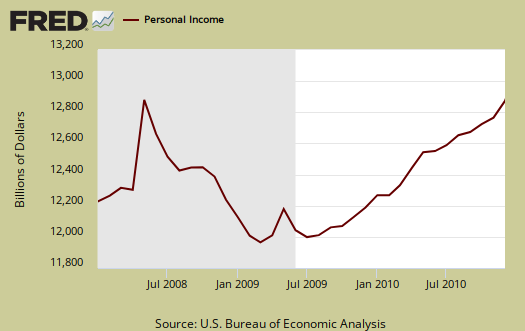
Personal income increased 0.4% in December and PCE or personal consumption expenditures increased 0.7%. In November 2010, personal consumption expenditures increased 0.3% and personal income grew by 0.4%. Below is the percent change in personal income and then the raw values. These numbers are not adjusted for inflation, or price changes.
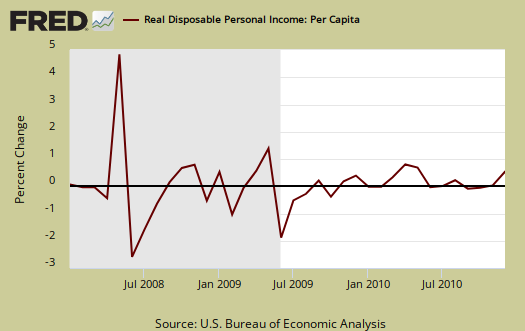
Real disposable income increased 0.1% in December in comparison to 0.2% for November while real personal consumption expenditures increased 0.4% for December in comparison to 0.2% for November.
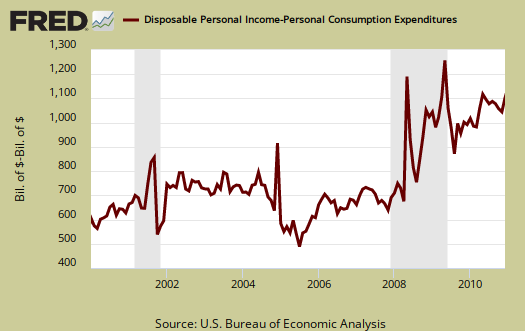
This means people spent more of their income in December and that for the month, the increases in spending exceeded the increase in money available for shopping. Remember these numbers include the uber-rich. Below is disposable personal income minus personal consumption expenditures monthly raw total changes.
Below is real disposable income per capita. Per capita means evenly distributed per person.
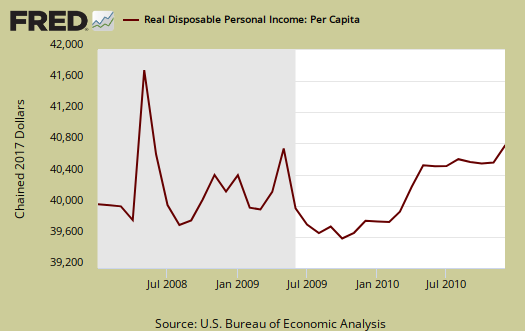
Pretty flat huh? The population in the U.S. increased 224,000 in the month of December. So, what sounds really good initially, if one looks at population growth, not so great. Remember the numbers reported in the press headlines are aggregates.
Personal consumption expenditures is the largest part of GDP, currently 70.8% of Q4 GDP is from PCE, so a 0.4% increase isn't great, but better than growth for the earlier part of the year. Below is a graph of real PCE, which is adjusted to not reflect inflation or price changes, in order to show the real economic activity versus gouging at the checkout line.
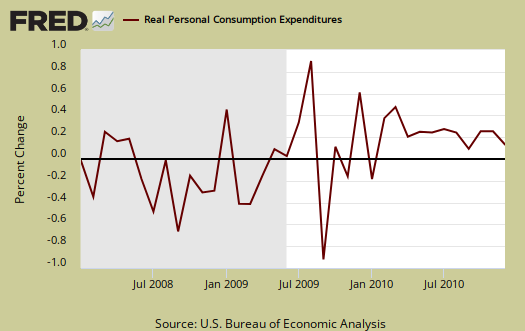
The PCE price index increased 0.3%, but minus energy and food increased 0.1%.
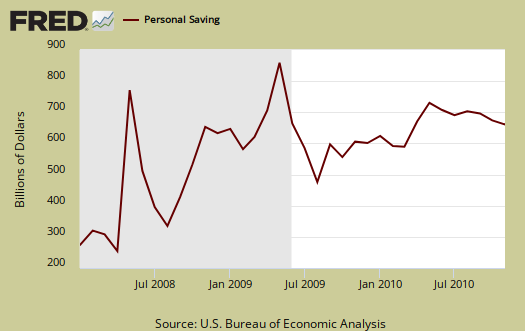
Personal Savings dropped from 5.5% to a 5.3% rate of DPI (disposable personal income) for December.
When digging into the nitty-gritty on wages and salaries, we have a acceleration of any increase, which considering the great income inequality and divide, stagnant wages, this is an improvement. Goods, and manufacturing payrolls increased.
Private wage and salary disbursements increased $15.5 billion in December, compared with an increase of $5.9 billion in November. Goods-producing industries' payrolls increased $1.5 billion, in contrast to a decrease of $2.5 billion; manufacturing payrolls increased $0.2 billion, in contrast to a decrease of $2.5 billion. Services-producing industries' payrolls increased $14.0 billion, compared with an increase of $8.4 billion. Government wage and salary disbursements increased $1.6 billion, compared with an increase of $1.3 billion.
Below is personal income minus transfer payments. This graph shows how much personal income increased that wasn't funded by the government. Transfer payments are payment from the government to individuals where no actual services (work) was performed. This includes social security, unemployment insurance, welfare, veterans benefits, Medicaid, Medicare and so on.
Personal current transfer receipts increased $3.8 billion, compared
with an increase of $8.7 billion.
Notice how Personal income minus help from the government is no where near pre-recession levels.

To visualize more data from this report, consider playing around with more of the St. Louis Federal Reserve Fred graphs.
Here is last month's overview, which also goes over the calculation used for the GDP report for PCE.
Recent comments