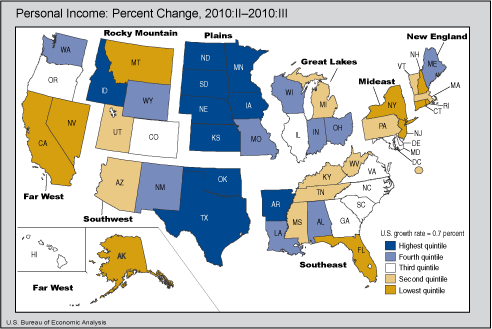
The BEA released personal income for states. Growth was only 0.7% for Q3 2010. PCE, or personal consumption expenditures had a price index increase of 0.3%. This is a deceleration of growth from Q2, which had an average personal income growth of 1.4%. Below is the BEA map showing which areas had the most gains from last quarter.

The slowdown was spread widely across the country with growth decelerating in 41 states, unchanged in 3, and accelerating in 6 states.
What you can see above is the declines in income match the state unemployment maps.
The BEA notes government workers lost income by 1.0%, nationally, due to the loss of temporary Census jobs. Farmers had a 12% jump in income and is reflected in the above map. Construction lost income, particularly in Nevada and Hawaii and those working in Real Estate, their income dropped also.
Here are the percentage changes from Q2 to Q3 2010:
- net earnings: +0.8%
- property income: -0.4%
- transfer payments: +1.3%
Delaware, America's tax haven, had income increase due to finance. Finance income increased in most states.
The St. Louis Fed has a large database of state personal income data. Graphs are available of each states and industries within that state.

Recent comments