
March Producer Price Index, or PPI for June 2010 came in at -0.5% from last month. Core PPI was -0.1%. May PPI was -0.3%. The original press release is on the BLS website. The reason for the drop is a -2.2% drop in food prices and a -0.5% in energy.

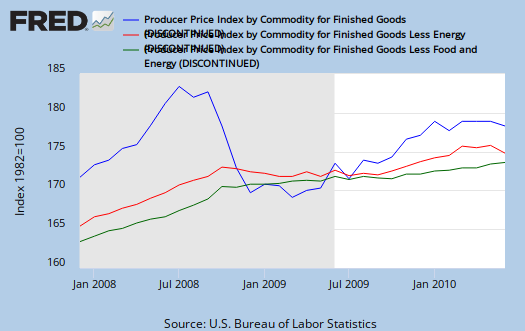
The graph below compares components of Core PPI (Finished goods minus food and energy).
Below is the graph for crude food goods. It is down -5.3% for June and -5% for the last 3 months. Crude core goods is also down -4.8% for June.
The index for crude nonfood materials less energy decreased 4.8 percent in June. For the 3-month period ending in June, crude core prices dropped 2.6 percent. This decline followed an 11.8 percent jump from December to March. Accounting for about thirty percent of the June decrease, the index for iron and steel scrap moved down 5.1 percent. Lower copper ore prices also contributed to the
decline in the crude core index.

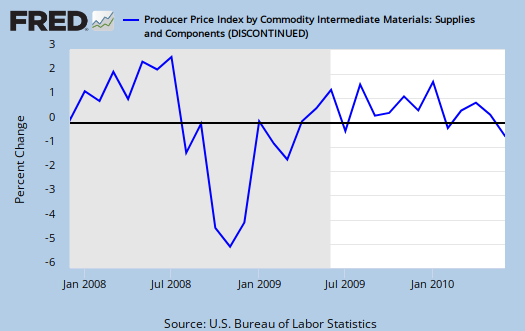
Intermediate goods dropped -0.9%.
Intermediate Materials, Supplies, and Components moved down 0.9 percent in June, its first decline since July 2009. About two-thirds of the June decrease can be attributed to lower prices for intermediate energy goods, which fell 2.6 percent. The index for intermediate materials less foods and energy also contributed to the overall decline, moving down 0.4 percent. By contrast, prices for intermediate foods and feeds inched up 0.1 percent.
Crude energy: The index for crude energy materials moved up 1.7 percent in June. From March to June, prices for crude energy materials fell 9.2 percent compared with a 9.0-percent increase in the previous 3-month period. About sixty percent of the June advance can be attributed to a 2.7-percent rise in the index for natural gas.

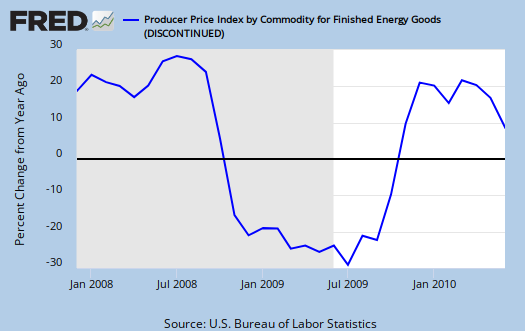
Below is the graph in finished energy from one year ago.
Overall this report implies deflation. While intermediate goods are a leading indicator of deflation, the crude goods is the worrisome number. See the below report for definitions, but crude goods are basically "untouched" materials at the start of the processing chain.
The attached report has detailed tables, with specific products and their price changes, at the bottom.
Recent comments