
Labor Productivity for Q1 2010 was significantly revised from the original report. Labor Productivity rose 2.8% in Q1 2010 versus the original 3.6% reported.
Nonfarm business sector labor productivity increased at a 2.8 percent annual rate during the first quarter of 2010, the U.S. Bureau of Labor Statistics reported today, with output rising 4.0 percent and hours rising 1.1 percent.
Hourly compensation increased 1.6% for the last four quarters.
For the year labor productivity increased 6.1% and hours worked fell 3.0% and output increased 3.0. They haven't seen numbers this high since 2002.
What caused the revision? People worked more hours than originally thought.
The basic equation for labor productivity is
Where Q is the total output of industry and Labor is measured in hours only. Both values are normalized to a base year.
Hourly compensation was also revised from 2.3% to 1.5% in gains. But this number is a bit misleading because in terms of real compensation, the people gained zero. In other words, people worked much more, yet hour per hour, gained nothing.
Unit labor costs in nonfarm businesses fell 1.3 percent in the first quarter of 2010, as the 2.8 percent increase in productivity outpaced a 1.5 percent gain in hourly compensation.
Below is productivity, compounded against last quarter percent change:

Productivity yearly change:
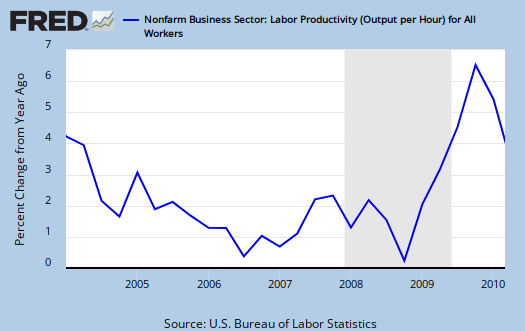
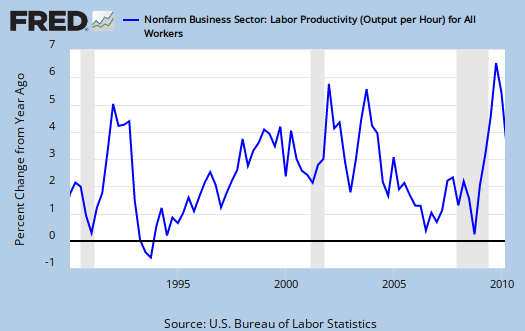
Below is a output per hours worked graph from 1990 until Q1 2010. Notice the huge spike in 2002, the same year corporations insisted on offshore outsourcing everything that wasn't nailed down, using the recession as cover.
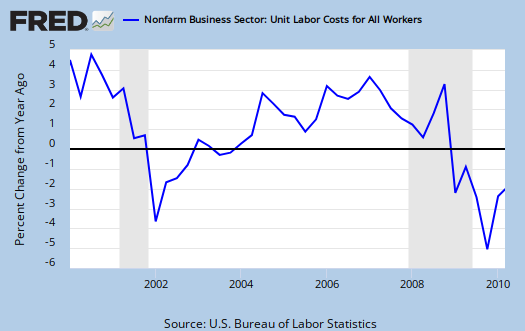
Below is the unit labor costs, compounded annual rate, percent change. Unit labor costs declined -1.3% for Q1 2010, -4.2% for the year.
Below is the graph of percent change in comparison to 1 year ago in unit labor costs. A reminder:
BLS defines unit labor costs as the ratio of hourly compensation to labor productivity.
Unit Labor Costs, from the previous quarter, annual change rate:

Below is the actual output graph. Raw output itself looks good, the levels back to pre-recession quantities.

How does the DOL calculate labor productivity?
Labor productivity is calculated by dividing an index of real output by an index of the combined hours worked of all persons, including employees, proprietors, and unpaid family workers.
This is all calculated from BSL CES and Current Population survey data and is in part, estimated.
Below is manufacturing productivity, where hours increased to 5.6 from 4.9, output decreased slightly from 7.5 to 7.2 and compensation....well, real compensation dropped -1.5.


Table B. Revised and previous measures for: first quarter 2010 and fourth quarter 2009

                  Nonfarm                                             Durable           Nondurable
 Sector           Business         Business         Manufacturing     Manufacturing     Manufacturing
              Revised Previous  Revised Previous  Revised Previous  Revised Previous  Revised Previous
------------------------------------------------------------------------------------------------------
                                Percent change, annual rate, first quarter 2010

Productivity    2.8     3.6      2.3     3.0        1.5     2.5       3.0      3.8       0.9      2.2
Output          4.0     4.4      3.7     4.1        7.2     7.5      10.2     10.5       4.4      4.8
Hours           1.1     0.8      1.4     1.1        5.6     4.9       7.0      6.4       3.4      2.5
Hourly
compensation    1.5     1.9      1.2     1.7        0.0    -1.2      -0.4     -1.2       0.3     -1.5
Real hourly
compensation    0.0     0.4     -0.2     0.2       -1.5    -2.7      -1.8     -2.7      -1.2     -3.0
Unit labor
costs          -1.3    -1.6     -1.0    -1.3       -1.5    -3.7      -3.3     -4.9      -0.6     -3.7
------------------------------------------------------------------------------------------------------
                                Percent change, annual rate, fourth quarter 2009

Productivity    6.3     6.3      6.6     6.6        6.5     6.5       7.0      7.1       6.2      6.1
Output          7.0     7.0      6.9     6.9        5.6     5.6       6.2      6.4       5.0      4.9
Hours           0.7     0.7      0.3     0.3       -0.8    -0.8      -0.7     -0.7      -1.2     -1.2
Hourly
compensation   -1.9     0.4     -1.9     0.4        2.0    -0.3       2.6      0.2       0.9     -1.2
Real hourly
compensation   -4.5    -2.3     -4.5    -2.2       -0.7    -3.0      -0.1     -2.5      -1.8     -3.8
Unit labor
costs          -7.8    -5.6     -8.0    -5.8       -4.2    -6.4      -4.1     -6.4      -5.0     -6.9

======================================================================================================
Table C.  Nonfinancial corporations: Preliminary first-quarter 2010 measures, and revised and
previous fourth-quarter 2009 measures
                                                        Real
                                           Hourly       hourly        Unit                    Implicit
             Produc-                       compen-      compen-       labor       Unit        price
             tivity    Output     Hours    sation       sation        costs       profits     deflator
------------------------------------------------------------------------------------------------------
                                Percent change, annual rate, first quarter 2010

Q to Q        4.2       6.4        2.1        1.7         0.2         -2.4          18.5         -1.2
Y to Y        6.1       2.8       -3.1        1.6        -0.8         -4.2          22.3         -1.8

                                Percent change, annual rate, fourth quarter 2009

Revised       7.0       7.3        0.3       -1.5        -4.1         -8.0          30.1         -2.9
Previous      8.2       8.5        0.3        0.2        -2.4         -7.4          28.7         -2.9
======================================================================================================
See the attached document, page 3 for the revisions laid out as tables.
Labor productivity had an astonishing 6.2% jump in Q4 2009.
Productivity is important because it is often used to claim technological advances are the reason more and more Americans are out of a job and why productivity increased. If that was true, one would see a linear pattern of increased productivity. Instead we see increased productivity jumps as businesses fire workers, offshore outsource jobs and use contractors in addition to technological changes. Currently government refuses to acknowledge or demand corporations report, how many jobs they offshore outsource, their global hire rates vs. domestic hires or even more detailed use of contract houses, body shops and permatemps in lieu of real employees. It is fairly clear labor arbitrage or firing workers, giving the rest a wage squeeze for the same or more amount of labor is occurring.
this report was released 06.03.10
But I thought it important to graph it out again for after this BLS release, we had the usual flurry of idiot reports out there trying to claim all job losses and increased productivity are due to more iphones and blackberries. (I think not).
Plantation Economics: Kansas Territory 1850, IT Workers 2010
From 1850 to 1860 Kansas settlers fought a guerrilla war against Cantrell's Raiders from Arkansas. Cantrell was fighting for the slave owners in Arkansas to kill any settler who would stand up for a Free Kansas. Kansas settlers continued to fight against a slave Kansas until the Civil War began.
In 2010, IT workers in the U.S. noticed that not only were they dealing with labor arbitrage (replace domestic with cheaper foreign Visa workers) but some U.S. based firms were using prison labor in India to offshore work from the U.S.
So the claim of increased productivity on technology alone continues to be a justification for old and new forms of the plantation economy in the United States for 150 years. The facts show that 2.2 million
H1B Visas have been granted in 20 years for
purpose of labor arbitrage. The firm cited
in this report has offices throughout the U.S.
See this link on MSNBC:
http://www.msnbc.msn.com/id/37114046/ns/business-world_business/
Burton Leed
the big uncoupling
The econ story of the going on quarter century is the uncoupling of productivity increases and increases in standard of living. Standard of living increases had been tied/explained by productivity gains shared with the workforce. For almost 20 years now business has been keeping more and more of the increases in productivity for itself. I'm sure that the baby-boom created ample supply of workers to allow business to capture all the extra money for itself. So does the tide go out as the baby boom workforce retires, and does a shortage of workers lead to a pre-baby boom sharing of productivity?
labor supply
You'll see a host of misinformation on population due to various special interests wanting no controls on immigration or corporate cheap labor supply, etc.
The reality is population does affect labor supply, which in turn can cause "worker substitution", i.e. worker displacement in favor of cheaper labor. Right now, you'll see a host of groups trying to deny these economic realities.
So, back to your question, there are also a lot of other variables, such as overall economic growth, the skills of various labor supply groups, labor laws, immigration policy and so on.
So, with globalization we have a host of jobs, parts of the overall supply chain, also offshore outsourced. The U.S. labor market, is not favored with a "hire American" within it's borders, or doing anything to stop offshore outsourcing, or stopping the jobs from going overseas. This means instead of a 154 million or so labor supply, multinational corporations more than access to a 1 billion labor supply.
Productivity only counts "domestic" hours of all workers (that's consultants, contractors, part time, workin' for free, the entire lot of U.S. labor). That said,
many products these days have a good portion of their development done in foreign countries, work that used to be done within the U.S. borders, thus counted as domestic.
We also have a massive underground economy with a significant illegal labor supply, est. about ~5% at least of the total U.S. work force.
So, if "hours" are not being counted, due to not being reported or really offshore "hours", this implies one can have productivity increases but no translation to passing those benefits down to the U.S. labor force in terms of jobs (real jobs) and wages.
The BLS as well as others will try to deny any of these factors or say they are trivial, but there are other economists who have looked into this and frankly it's not trivial. I'd say the proof in the pudding are the graphs themselves. They correlate more to when companies are firing people and offshore outsourcing jobs way more to any major technological innovation happening, although technological innovations do improve productivity.