
A few months ago, I noticed something that seemed strangely discordant about our "Great Depression 2": consumers were refusing to stay dead, but instead showed signs of - at least partially - rising from the grave.
But a look at truck traffic (which is only posted monthly) and rail traffic (which is updated weekly) showed a continued year-over-year slide.
I took a further look because one very prominent blogger has recently alluded to rail traffic several times, most recently saying it was "horrible" and "13-week moving averages are still moving lower, with no apparent end in sight" So, what's going on? Does rail traffic in particular mean the recession is continuing to plunge deeper into the abyss, or are there signs of some stabilization?
Here is the group of charts, courtesy of Railfax, showing the 13-week moving average of year-over-year rail traffic:
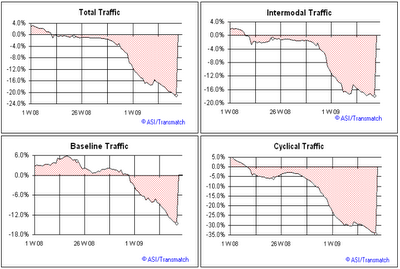
Note they show that the average continues to plunge. But, keep in mind that this 13 week average compares data from mid-March to mid-June 2009, and compares that with mid-March to mid-June 2008 -- so it is truly a very lagging indicator, in essence telling us that the period of time leading up to end of April 2009 was far worse than that period leading up to the end of April 2008. Well, duh! For confirmation, note that the year-over-year averages above didn't turn negative until February 2008 -- two months after the recession began.
But now let's look at the same site's data showing the 4-week average of raw current data, both for 2008 and 2009. These four week averages tell a different story. The four week moving averages not only tell us that 2009 is worse than 2008, they also tell us that 2009,after an initial bounce, has been flat in the second quarter, in comparison with a rise in traffic in spring 2008. In other words, the year-over-year comparison isn't declining because traffic in 2009 is continuing to slide further, but rather because an increase in traffic from spring 2008 isn't being repeated:
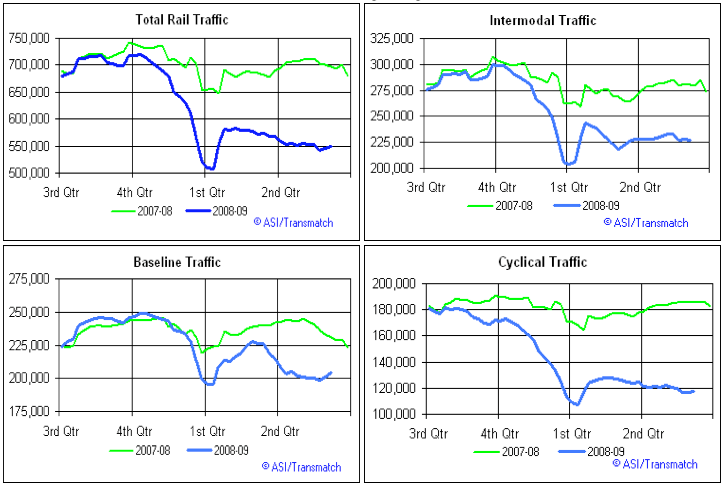
Additionally, note that (1) this average did peak in October 2007, several months before the onset of the recession; and (2) the most current weeks of data in 3 of the four 4 week graphs show a small upturn in 2009 traffic, compared with a decline in traffic in the same period in 2008.
So is trail traffic generally getting worse, or stabilizing?
Rail traffic is moving goods to market. To properly interpret the data, we should compare with retail sales; in other words, how well did the goods moved to market sell?
And this solves our mystery. From the very beginning of the recession onward, retail sales began to turn down:
Despite this, business inventories continued to rise:
Once the Wall Street/housing depression metasticised to Main Street in late 2008, retail sales plunged. All of those increased goods being hauled by railroads in spring 2008 failed to sell, leaving retailers with a huge supply of unsold inventory on their hands, as evidenced by the inventory to sales ratio:
Because inventories, as per the above graph, tend to lag sales, after the plunge businesses cut back dramatically on their incoming inventory. That overhand of inventory has only partially been worked through. Hence railroads continue to haul fewer goods to market. But as shown in the retail sales graph above, retail sales have generally stabilized at a level about 10% less than before the recession. Even automobile sales appear to have stabilized albeit at a rate about just below 10 million vehicles a year. So if incoming inventory continues to plummet as retail sales stabilize, the inventory to sales ratio could decline towards normalcy just as quickly as it rose. When that happens, railroad loads will start to increase.
Look again at the 4 week averages above, where I pointed out the small upturn in the last few weeks of data. It is certainly too soon to say that is a trend, but it could be the beginning of one, and if that is the case, then the lagging indicator of the 13 week year-over-year average cited by that prominent blogger will abruptly begin to rise - a couple of months from now.
To his credit, that other prominent blogger concludes that "The good news is a bottom might be coming." But one of the things I constantly harp on is that to discuss where the economy will be in the future, one needs to look at leading economic indicators, and analyze them. The worst way to discuss where the economy is going is simply to project coincident - or worse, lagging - economic indicators into the future. In projecting that "13-week moving averages [year-over-year railcar loads] are still moving lower, with no apparent end in sight", our prominent blogger has done exactly that.
Comments
For once the anecdotal matches
In two ways:
1. As the recession gets worse, one sector I'm seeing get the customers is *local* businesses- those that depend on natural resources within easy farm trucking distance of a city, or that rely on lesser amounts of imported natural resources and local manufacturing. Farmer's markets, craft fairs, and the like are getting the business- and they don't need long distance shipping.
2. There was a recent story in the Oregonian that pointed out that many smaller towns in Eastern Oregon are seeing a new visual blight to their vistas: idled railcars, excess capacity in the system that is being parked just wherever the rail companies can find the space. Originally bought for a new boom in the late 1990s and early 2000s in rail shipping, which is much more environmentally friendly than truck shipping, the rail companies overpurchased rolling stock, and now that the trains aren't rolling, are having problems finding rare sidings to park cars on.
-------------------------------------
Maximum jobs, not maximum profits.
-------------------------------------
Maximum jobs, not maximum profits.
too much fun
I would say "let that be a lesson to anyone" who just takes a graph or a scalar (number) and extrapolates the end of the world from that.
Although one thing I am really wondering about is EIs and their divergence from the real economy. We know this is true for the middle class, plenty of data showing the slide in wages over 30 years, career stability and so on.
I mean if we do not look at one in particular lagging indicator, jobs, esp. right now, the stats are looking like bottle rockets giving off warnings (straight up!) ...well, there is no recovery on main street.
(but I think you mean in your post lagging indicators that are more about GDP and their implications thereof).
Did you see the further breakdown/debate of CPI coming from the Atlanta Fed blog? (bottom right and they are running a fantastic blog!)