
The December 2011 Residential construction report showed Housing starts dropped -4.1% from November's revised 685,000, to a level of 657,000. This is +24.9% above December 2010, or 526,000 housing starts. Housing starts decline was due to apartments, 5 units or more of one building structure, which dropped -27.8% in one month.
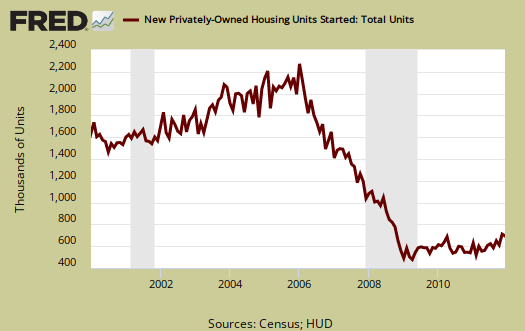
The yearly percentage change is 3.4%. While still at record lows, it's a slight improvement and the best we've had since 2008, but from the graph below, one can see how badly the bubble burst on residential real estate.

New Residential Construction has a margin of error often above the monthly percentage increases. December, for example, has a error margin of ±11.6% percentage points on housing starts. Below is the monthly change so one can see the wild fluctuations.

Additionally, as we see in the above graph, the monthly percentage change is quite noisy, even though this monthly economic report is seasonally adjusted. This is why it's better to look at the overall unit levels instead of the month to month percentage change.
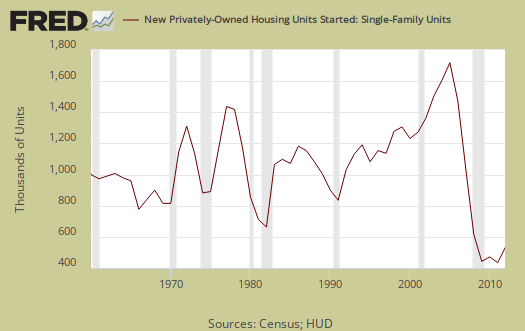
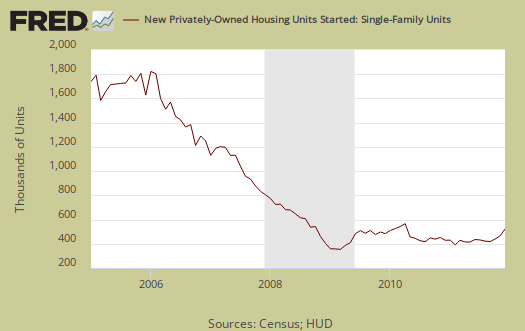
Single family housing starts increased +4.4% from November. Single family housing is 75% of all residential housing starts. 2011 Single family housing starts are the worst on record, decreasing -9.0% from 2010 to 428,600 units. Below is the yearly graph of single family housing starts going back to 1960.
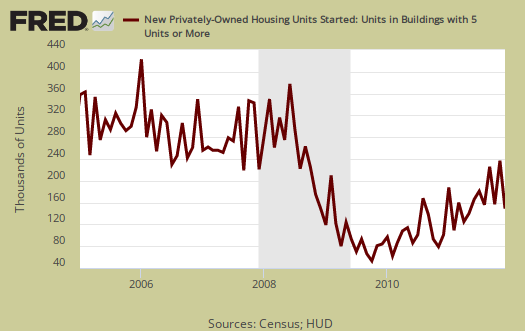
Housing of 5 or more units for 2011 has increased 60.5% from 2010 with 167,400 units this year.
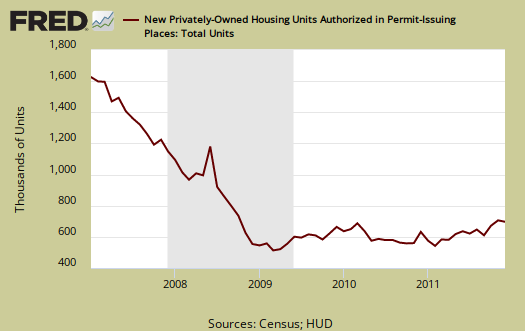
Building permits decreased -0.1% to 679,000. and are up +20.7% from this time last year. Single family building permits increased +1.8% from November. Building permits have much less statistical error, ±1.2%. Below is the St. Louis Federal Reserve FRED graph for Building permits. The graph shows building permits are not always a smooth line from month to month.
Housing Completions increased by +9.2% and are now up 7.1% from December 2010. This number reflects housing starts earlier reported.
This report has a large variance, so to establish a trend line one must take into account months of data. This report is also seasonally adjusted and residential real estate is highly seasonal.
Some things to take away from this report is multi-family, otherwise known as rental units, are really taking off and no surprise there since the mortgage lending standards are so tight and there are so many foreclosures. A silver lining to the destruction of the American Dream.
Another point is the traditional house, single family is very D.O.A. Below is the graph of single family housing starts on a monthly basis.
I recommend Calculated Risk, the uber site on housing data, for more graphs and analysis..
Additionally the Q3 home and rental vacancy rate report, released by the Census November 2nd, has state by state data on their website.
Here is last month's new construction overview, unrevised.
Single family record low
This report overview maybe late but that's frankly significant. I think "analysts expect" housing to recover has been issued for the last 5 years, yet here is 2011 with a record low for single family housing. I believe there is still huge shadow inventory and last I saw foreclosures were being delayed. So, 2011 could be a bottom but I sure don't expect much of a pop-up soon.