
The January 2012 Residential construction report showed Housing starts increased 1.5% from December's revised 689,000, to a level of 699,000. December housing starts were revised significantly, from 657,000 to 689,000. January 2012 is now 9.9% above January 2011's 636,000 housing starts. Housing starts increase was due to apartments, 5 units or more of one building structure, which increased 14.4% in one month. Single family housing starts declined, -1.0%, from December 2011.
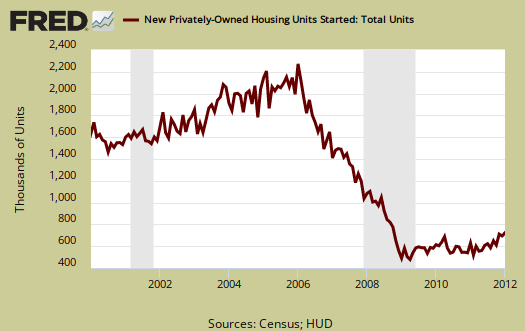
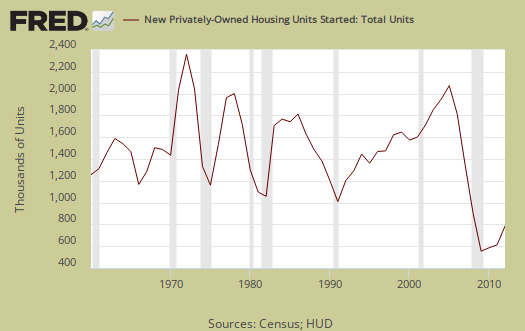
Below is a graph of housing starts going back to 1960. One can see how badly the bubble burst on residential real estate.
New Residential Construction has a margin of error often above the monthly percentage increases. January, for example, has a error margin of ±14.2% percentage points on housing starts. Below is the monthly change so one can see the wild fluctuations.
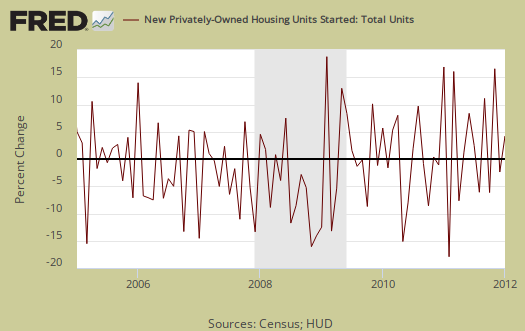
Additionally, as we see in the above graph, the monthly percentage change is quite noisy, even though this monthly economic report is seasonally adjusted. This is why it's better to look at the overall unit levels instead of the month to month percentage change. Supposedly the claim for housing start increases is unusually warm weather in January.
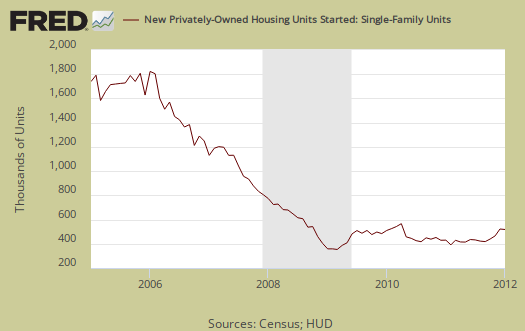
Single family housing starts decreased 1.0% from December. Single family housing is 75% of all residential housing starts. Below is the yearly graph of single family housing starts going back to 1960.

Housing of 5 or more units for 2011 has increased 60.4% from 2010 with 167,400 units in 2011.

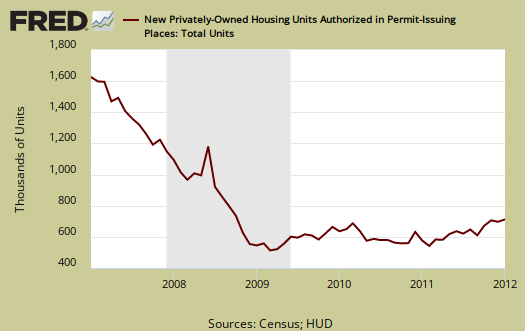
Building permits increased 0.7% to 679,000. and are up 19.0% from this time last year. Single family building permits increased 0.9% from December. Building permits have much less statistical error, ±1.2%. Below is the St. Louis Federal Reserve FRED graph for Building permits. The graph shows building permits are not always a smooth line from month to month.
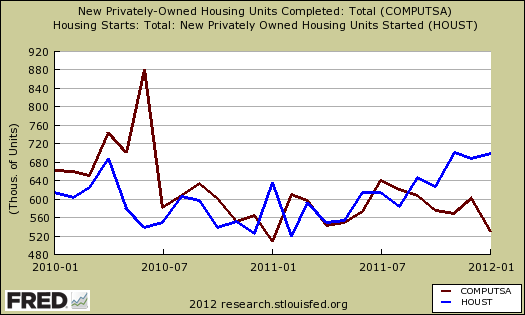
Housing Completions decreased by -12.0% and are now up 4.1 from December 2010. This number reflects housing starts earlier reported.
This report has a large variance, so to establish a trend line one must take into account months of data. This report is also seasonally adjusted and residential real estate is highly seasonal.
Some things to take away from this report is multi-family, otherwise known as rental units, are really taking off and no surprise there since the mortgage lending standards are so tight and there are so many foreclosures. A silver lining to the destruction of the American Dream.
Another point is the traditional house, single family is D.O.A., although now classified as Zombies. Below is the graph of single family housing starts on a monthly basis.
I recommend Calculated Risk, the uber site on housing data, for more graphs and analysis.
Some are making the divergence between housing starts and completions a big deal. It's not really. Completions lag starts and earlier starts were at all time lows. There are also starts back logs which are probably worked off by now. This report has large error, plus is seasonally adjusted. The weather this winter has been unusual, which also can throw off starts vs. completions. Below is a graph to show the divergence of the two metrics isn't that unusual on a month per month basis.
Here is last month's new construction overview, unrevised.
Recent comments