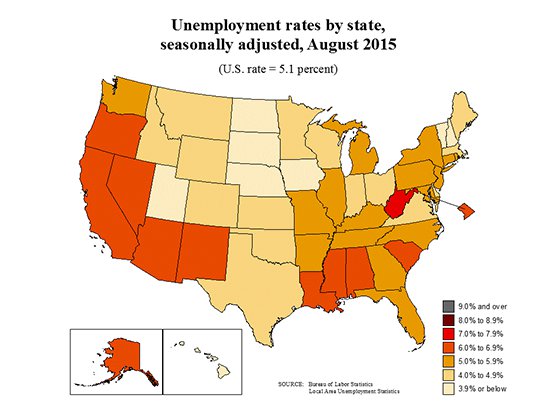
The August state employment statistics shows the unemployment situation for states and regions is little changed from July. From July 18 states lost jobs while 32 states gained them. The national unemployment rate was 5.1% and 29 states showed an unemployment decrease while in 10 states the unemployment rate went up. Below is the BLS map of state's unemployment rates for the month.

August showed a -0.4 percentage point drop in the South Carolina and and a -0.3 percentage point change in Virginia and Ohio. Only one state has a rate above 7.0%. That's West Virginia with an unemployment rate of 7.6%. Plenty of states have rates above 6%. Both the Nevada and D.C. unemployment rate is 6.8%. New Mexico is 6.7%, Alaska, 6.6% and both Arizona and Mississippi are 6.3%. Nebraska has an astounding 2.8% unemployment rate. North Dakota still maintains the 2nd lowest with 2.9%.
The unemployment change from a year ago nationally has declined by -1.0 percentage points. Seven states saw unemployment rate annual increases, with West Virginia increasing by 1.2 percentage points. Rhode Island's unemployment rate droppped by -1.8 percentage points and Michigan also had a significant -1.7 percentage point decline.
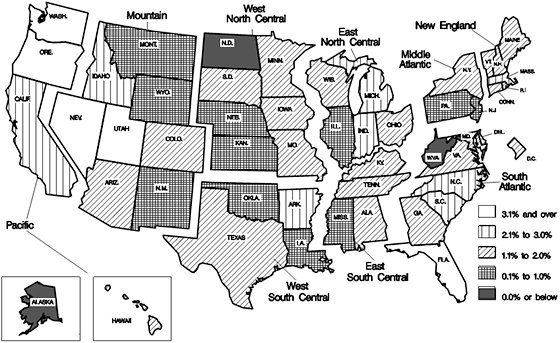
For the month, state monthly payrolls increased in 32 states and decreased in 18 states plus the District of Columbia. By percentages of total payrolls, South Dakota showed a -0.7% decrease in jobs. Delaware, and New Hampshire both declined by -0.6% in monthly payrolls. Employment gains were huge in Hawaii for the month, 1.3%, whereas Nebraska also increased 0.6% and Maine did to with a 0.4% monthly change.
For the year, payrolls increased in 47 states plus D.C. and decreased in three states. West Virginia declined by -2.6%, North Dakota by -0.7% and Alaska by -0.4%. For the year Utah shows a 4.0% employment increase, Oregon, 3.5%, with Florida and Nevada showing a 3.3% increase. The below map shows the past year ago change for payroll growth.

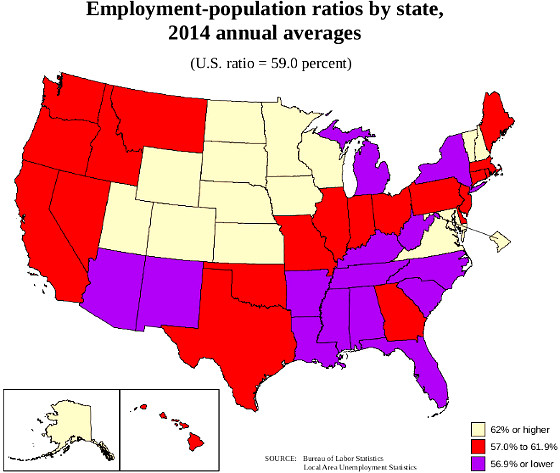
While the unemployment rates have improved, one needs to also look at the labor participation rate, which nationally is still at record lows. Below is the BLS map for the annual 2014 population to employment ratios and the August rates are here. When one sees a low population to employment ratio along with a high unemployment rate, most likely this implies people are not being counted as unemployed.

Generall speaking this month's report is no surprise. West Virginia is clearly losing jobs due to coal and other industries and North Dakota is getting hit by lower oil prices. The real question is how many hidden unemployed are there still who are not being counted. While baby boomers are retiring, those record low participation rates point to something more going o All above maps were created by the BLS.
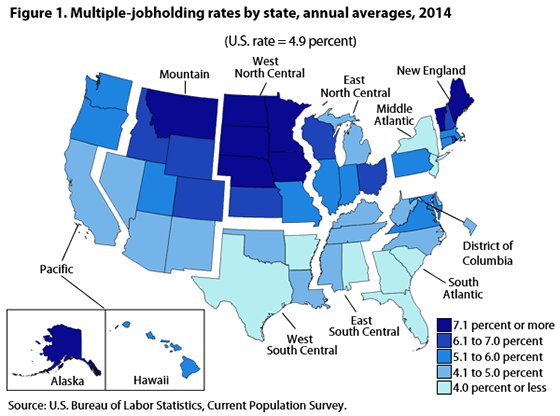
Earlier this month the BLS publish the multiple job holding rates by state, national 2014 averages. Below is their map. What is interesting is how many multiple job holders they are in states with fairly low unemployment rates. South Dakota for example has a multiple job rate of 8.7%.

More interesting the national average of multiple job holders rate has stayed the same since 2010 and is 4.9%. According to the BLS, the trend for these states to be high has been true the entire time they have been tracking on those holding down multiple jobs. Seems the cold prairie states people really work hard and long.

Recent comments