
The BLS has released their Regional and State Unemployment Report for May 2011. California lost 29,200 jobs in a month. New York lost -24,700 more jobs and Michigan continues to not get a break, they just lost another -13,400 jobs. Overall the BLS reports there is little change in the May State employment figures. This is the mantra, persistent economic malaise and a never ending jobs crisis.
Regional and state unemployment rates were little changed in May. Twenty-four states recorded unemployment rate decreases, 13 states and the District of Columbia registered rate increases, and 13 states had no rate change.
Below is the unemployment rate for California.

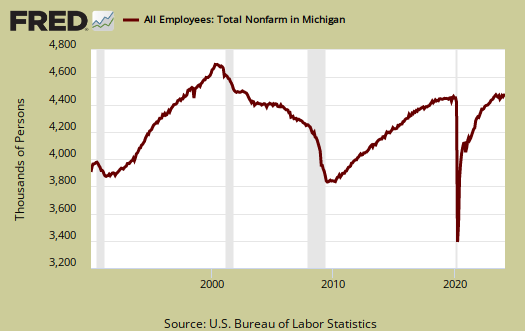
Look at this graph of Michigan jobs, up to April. They have lost two decades of job growth.
In May, nonfarm payroll employment increased in 22 states, decreased in 27 states and the District of Columbia, and was unchanged in 1 state. The largest over-the-month increase in employment occurred in Florida (+28,000), followed by Ohio (+12,000), Arizona and Louisiana (+10,100 each), and Texas (+8,800).
Wyoming experienced the largest over-the-month percentage increase in employment (+0.8 percent), followed by Louisiana (+0.5 percent) and Arizona and Florida (+0.4 percent each).
The largest over-the-month decrease in employment occurred in California (-29,200), followed by New York (-24,700), Pennsylvania (-14,200), Michigan (-13,400), and Maryland (-13,300).
Alaska experienced the largest over-the-month percentage decline in employment (-1.5 percent), followed by Vermont (-1.2 percent), Delaware (-0.9 percent), and West Virginia (-0.7 percent). Over the year, nonfarm employment increased in 39 states and decreased in 11 states and the District of Columbia.
The largest over-the-year percentage increase occurred in North Dakota (+4.3 percent), followed by Texas (+2.0 percent), Nebraska (+1.9 percent), and Wyoming (+1.7 percent).
The largest over-the-year percent decrease in employment occurred in Maryland (-0.8 percent), followed by New Mexico (-0.7 percent) and Georgia and Nevada (-0.6 percent each).
Bear in mind, while some employment rates go down, that could be due to people dropping out of the labor force tallies, so a better indicator is the raw number of jobs, since we do not have labor participation rates for each State.
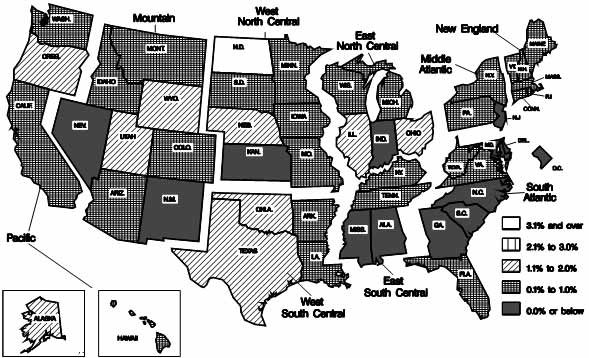
Below are the maps the BLS releases with their report. The first map shows the percentage change of the actual number of jobs in each state for the past year. Notice how Nevada and the Southern States have zero change on the actual number of jobs in each state as well as how little has changed, by percentages across the nation, for an entire year.
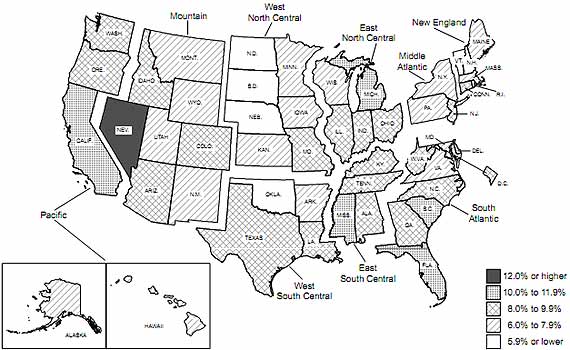
The next map shows the actual unemployment rates in each State.
For more state employment maps, try GeoFred.
Wall Street Journal interactive map
WSJ runs an interactive map on just the employment rate, here and I will update the Michigan payrolls graph when the actual raw data is released.
It's not available yet. The spin is how the employment rate may have dropped, one just cannot say that at this point, it's about payrolls, self-employed, jobs, and civilian non-institutional population growth, participation rates.
EPI doesn't put any warm fuzzies on this report either, some state job gains go into reverse.
That's no lie, some regions are actually losing more total non-farm payrolls as their population increases.