
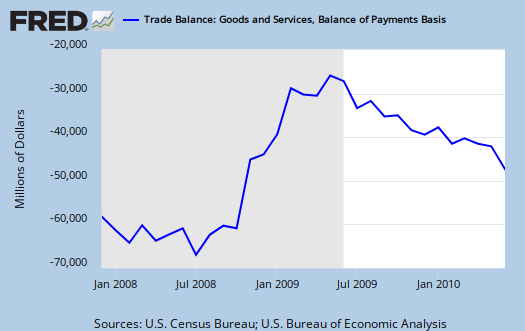
The June 2010 U.S. trade deficit increased from last month's $42 billion (revised) to $49.9 billion. That is a 14% U.S. trade deficit increase in one month. Even worse, U.S. exports decreased by $2.0 billion, to $152.4 billion, while imports increased $5.9 billion, to $200.3 billion.
For the year imports are almost a 2:1 ratio to exports. From the report:
The goods and services deficit increased $22.8 billion from June 2009 to June 2010. Exports were up $22.6 billion, or 17.7 percent, and imports were up $45.3 billion, or 29.2 percent.
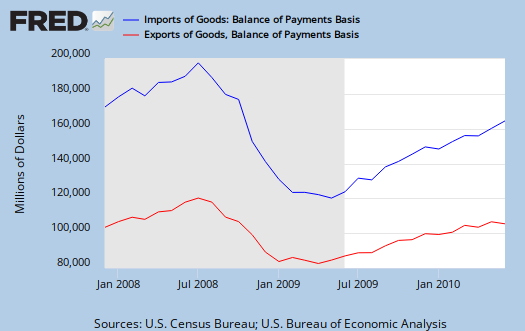
Below are imports vs. exports of goods from the official start of this recession. Notice the increase in imports and the decrease in exports for June. Also notice how exports is nowhere near pre-recession levels and even then, the trade deficit was a horrific economic problem.
Here's the breakdown between goods and services, with goods being the majority of U.S. trade. Notice the wording to minimize the impact of a massive deficit. Also notice service imports (read offshore outsourcing) also increased by a 2:1 ratio this month:
The goods deficit increased $7.7 billion from May to $62.0 billion, and the services surplus decreased $0.2 billion to $12.1 billion. Exports of goods decreased $2.3 billion to $105.0 billion, and imports of goods increased $5.4 billion to $167.0 billion. Exports of services increased $0.3 billion to $45.5 billion, and imports of services increased $0.6 billion to $33.3 billion
Contained within the below paragraph, literally you can see the offshore outsourcing of automotive engines and parts. While exports in automotive decreased, imports increased and by a 6:1 ratio.
The May to June decrease in exports of goods reflected decreases in capital goods ($1.4 billion); industrial supplies and materials ($1.0 billion); and foods, feeds, and beverages ($0.3 billion). Increases occurred in automotive vehicles parts, and engines ($0.2 billion); other goods ($0.2 billion); and consumer goods ($0.1 billion).
The May to June increase in imports of goods reflected increases in consumer goods ($3.1 billion); automotive vehicles, parts, and engines ($1.3 billion); other goods ($0.6 billion); and capital goods ($0.5 billion). A decrease occurred in industrial supplies and materials ($0.2 billion). Foods, feeds, and beverages were virtually unchanged.
Here we see advanced technology deficit increasing. These products are the supposed jobs of the future as well as critical to national security.
Advanced technology products exports were $23.2 billion in June and imports were $31.6 billion, resulting in a deficit of $8.4 billion. June exports were $1.4 billion more than the $21.8 billion in May, while June imports were $4.0 billion
more than the $27.6 billion in May.
Below is the annual percent change of Chinese imports into the United States. The deficit with China, not seasonally adjusted, was -$26,152 billion, which is a 15% increase in one month! That's 42% of the total not seasonally adjusted trade deficit, including oil. This percentage and raw China trade deficit total is not seasonally adjusted.

Here is the Government website on Foreign Trade. Here is last month's (unrevised) trade report.
Recent comments