
I really admire Paul Krugman. He's honest to a fault, and during his appearance on ABC's This Week that came out again. As he put it:
We've got a problem with terminology because we usually say either the economy is in recession or the economy is recovering. Either you're in hell or you're in heaven. And the trouble is we're actually in purgatory. We're actually in a situation almost for sure GDP is growing; almost for sure the business cycle leading committee will eventually decide the recession ended this summer. But almost surely also we're still losing jobs. The unemployment rate is going to continue to rise. So we're in that infamous jobless recovery state.
Purgatory
Purgatory is an almost perfect description of the economic condition that the United States currently finds itself in.
Let's be clear. The free fall is over for the moment, but we are still losing jobs, and will be for a while.
And Krugman's right that we've got a problem with terminology, because for most people recovery has nothing to do with the ups and downs of the Dow Jones Industrial Average. For most people, recovery means that people are getting jobs. It's likely quite some time before that happens.
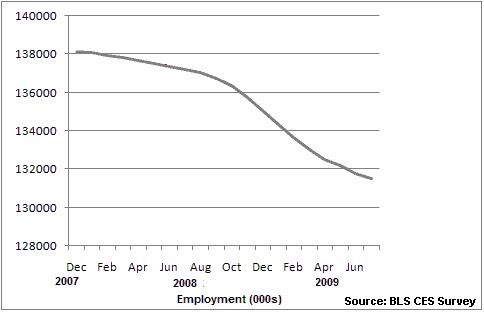
Seasonally adjusted employment is down 6.66 million since December of 2007. This means that just to get back to where we were in job terms the country needs to create nearly 7 million jobs. There are around 131 million Americans who are currently employed in the non-farm sector. And although the rate of job losses has slowed we are still a long way out from positive job growth.
If we take July as the end of the recession, then we are 20 months out from the start of the recession in December 2007. In order for employment to return to December 2007 levels by 20 months out of the recession in March 2011, we would need to see a minimum of 333,200 jobs created for each of the next twenty months. That's highly unlikely. In all likelihood, we aren't going to see the end of the recession in terms of a return to December 2007 employment levels until at the earliest 2012.
Compounding this is limited growth in the labor force. Each time an 18 year old decides that they are going to get a retail choice, the labor force grows. While the labor participation rate has been basically steady at the national level (there are interesting differences at the state level) a growing population means a growing labor force. At the start of the recession in December 2007, there were 153,866,000 persons in the labor force (not that this includes both the unemployed and farm employment, hence the difference with the earlier employment number). In July 2009, there 154,504,000 persons in the labor force. Which means that not only do we have to recoup those 6.66 million jobs lost since 2007 to get back to where we started. We also have to create another 638,000 jobs for the people who have entered the labor force since that time. So basically, we need to create 7.3 million jobs, just to get back where we started.
It's almost certain that that is not going to happen until at least 2012. 2010 is going to be a very hard year economically, and unless things improve markedly, it's going to be a running fight to keep the seats that Democrats took from the GOP in 2006 and 2008. Imagine who much fun it would be if the House flipped back to Republicans. With a 76 Dem seat lead it would take a lot for that to happen, but there are a number of seats that could flip in a hard year. Just in Indiana, I think that there is always going to be strong competition in the IN-2, IN-8, and IN-9.
Setting the record straight
Returning to the subject of jobs, I wanted to finish up this with an update on the auto weirdness situation I highlighted about a month back. In a diary from last month I argued that the initial claims data was presenting an inaccurate picture of the unemployment situation because of the timing of this years auto shutdowns. At that time, another Kossack launched a personal attack against me because of the argument that I was making. In the end this Kossack concluded that in the end, the statistics coming out in August would show who was right.
Those statistics have since come out, and my argument was proved correct. The odd timing of the auto shutdowns at GM and Chrysler skewed the seasonally adjusted numbers creating the appearance of declining initial claims in July when in fact they were rising. This same anomaly created the slight drop in the unemployment rate in July, and it's almost certain that when we get the August unemployment numbers, there will be a big jump as a result of this statistical artifact.
The Mess that Greenspan Made laid out the case for a flaw in the seasonal adjustment formula very well.
This is what the unadjusted auto employment changes (month over month) look like for the past ten years:

As you can see, normally there are a number of layoffs that occur in the auto industry in June, and these workers are brought back on the job in August. This year, those layoffs started in late April and May, and these workers came back on the job in July. Which means that they were coming back on the job right at the time that they were supposed to be going out for layoffs.
It's easier to look at this using the table at the BLS that reveals what is taken as the normal seasonal movement. The BLS expects that from June to July, employment in the "Motor vehicles and parts" sector will naturally fall by 36,800. This is because there is the expectation that there will be auto layoffs. In really, the month over month change from June to July for "Motor vehicles and parts" was negative 8,600. These were real job losses, no temporary layoffs. However, because they BLS assumes that temporary layoffs will lead to 36,800 job losses, this 8,600 job loss was translated into a job gain of 28,200 because of the seasonal adjustment formula.
The problem is that come the release of the August numbers, there is going to be an expectation that those 36,800 workers who are assumed to be on temporary layoff in the seasonal adjustment model will come back on the job. This isn't going to happen, which means that the same statistical artifact that created to inaccurate appearance of a fall in initial claims numbers in July, and a drop in the unemployment rate, is going to strike back in August.
I can't locate what the BLS assumption is for the number of jobs that will be created in the "Motor vehicles and parts" sector in August is, but it is almost certainly at least 36,800.
We don't need to wait for the release of August unemployment numbers on September 4th to understand that the backside of the seasonal adjustment formula is making things look worse when they come in. Unemployment numbers are released on a monthly basis. They include a larger pool of workers since they include those who are unemployed, but not receiving unemployment insurance benefits. And since around 55% of those who are unemployed receive no unemployment benefits, this is a much larger pool.
The numbers on initial claims for unemployment insurance are released on a weekly basis. So we already have the numbers for most of the month of August, and we can see that the assumption that auto workers will be coming back on from having been laid off is really jacking up the seasonally adjust numbers.
Let's take a look at this.
If we look at the seasonally adjust numbers from the beginning of the year to the time that Bonddad wrote his diary on July 16 in which he pointed to a falloff in initial claims as evidence that the employment situation was improving, and presumably would continue to do so. Here's the chart:
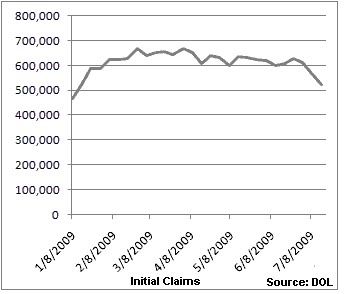
Between the end of June and the middle of July there was a drop in seasonally adjusted initial claims. If we take the 4 week running trend as an indication of things to come, we create the expectation that on average initial claims will fall by 21,500 each week. Extending this trend out to the present, the prediction is that the seasonally adjusted 8/20 initial claims number would be 436,000. The actual seasonally adjusted number for that date? 576,000. Which means that the prediction was off by almost a third.
What happened?
The backside of the statistical artifact that created the impression of rapidly falling initial claims numbers in July hit.
It's easier to explain in terms of the seasonally adjusted versus unadjusted numbers.
So lets look from March of this year to the present.
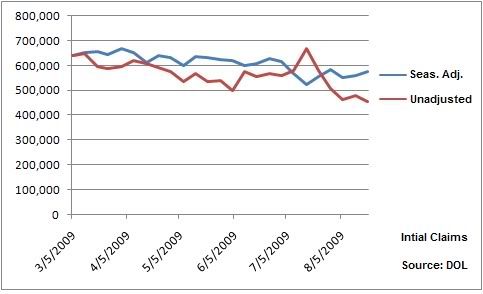
The same flaw in the seasonal adjusting formula that created the appearance of falling initial claims while they were actually rising is now striking back. With the exception of some very small job increases coming from the CARS program that will most likely materialize in September, there is no huge increase in auto employment. Because the layoff didn't happen at the normal time. And there is going to be a layoff at GM either at the end of September or early October.
The bottom line is that things weren't getting better in July, and they are getting worse right now. The numbers gave everyone a rope a dope because they included bad assumptions. We should all expect there to be an increase in the unemployment in the August numbers, but ultimately things probably are stabilizing for the moment.
There is still a strong possibility that CIT is going to declare bankruptcy, and that this will lead to a credit crunch for small retailers. That would mean job losses in retail exactly at the same time that stores would normally be ramping up for the Christmas season.
The bottom line is that we aren't in economic heaven, or economic hell. Welcome to economic purgatory.
Comments
middle
did you check the Instapopulist first? ;)
Yep
that's where I got it from
looks a little redundant
although what a great phrase. I also like Reich's "out of the woods means you're out to sea".
I don't think it's a "personal attack" but I do believe some people became too emotionally vested in to the predictions.
If it makes you feel better I've seen similar type of things with Jerome A Paris and even midtowng.
Even better on the financial blogs is a major war on the effectiveness of the Stimulus with me, sitting in the peanut gallery wondering if a little sexism is coming into play (although I think the entire multiplier, grand scale "throw money at it" is wrong, and should be very targeted government expenditures, mostly public works or production investments of some sort)
I've been planning
to do a post on the auto weirdness that has been affecting the initial claims data. The thing that you pointed me to from TGTGM is very useful. BTW have you seen the latest bit from Hale over at Daily Kos.
This is getting really old. He's been saying that the recession is over since it began. How long can you keep this bullshit up without being called out like Jim Cramer was.
The truth of the matter is that Bonddad is Cramer, and I'm frankly getting sick of this. Bullshitters deserve to be called out, and that's what Bonddad is.
blog wars
ok, firstly if you are going to single out one blogger (when we have daily cheer-leading headlines from the MSM), please don't focus on the personal and prove your point with specifics, i.e. specific posts, specific data, specific issues. Keep it on the #'s and not the person.
Also, I know some of us (who will remain nameless) have past posts where we have missed so far...in fact I don't any of us have gotten every single thing right.
I mean it is so easy to do! But if one is brazenly ignoring a lot of data or truly spinning, that's another thing.
i.e. CNBC and the entire MSM with the Dot con era, the housing bubble, the trade data (the list is a mile long from the MSM).....
I know a lot of people are fairly pissed that somehow Bonddad has been declared king of the economic left, all things considered, but I'll stick with this site's objective, which is when in doubt, use a calculator, in other words, the numbers, if one digs around and works on their analysis....do show the current state of purgatory...the idea is to get people to start learning how to read/understand/pay attention to all things econ instead of just cheer-leading some other person without actually working on their comprehension level for themselves.
I'm going to point out the auto weirdness
and the mistaken impression of the economy that it generates.
At this point we are far enough into August that I can demonstrate with initial claims data that the point I was trying to make about problems with the seasonal adjustment formula is real. The bottom line is that we are basically in purgatory. We are still in economic decline, it's just that the freefall has ended for the moment. NDD called me out on this point over at Big Orange last month, and basically said that we'll see if you are right. Now I have the data to demonstrate that the problems I was suggesting were influencing the data have influenced the data.
Basically all that I want to do is demonstrate to the people who attacked me last month that I was right, and they were wrong. There is nothing horrible about being wrong, but there is something deeply offensive about continuing with an argument when the facts show it to be wrong. And personally attacking anyone who point out that there was a problem with your data. That's what's pissing me off.
Own up to your mistakes, don't attack the people who point them out.
I hear ya
I saw that whole thing and thought, ya know, shall we continue to work on our statistics and understanding everyone?
But on the other hand, when things are mathematically, logic, analytical driven, I have always been astounded at the politics.
Seriously, in Engineering, I'm like, "hey awesome idea, great design, obvious improvements" yet if you are in a bad team, bad whatever, someone will pound on the person with the great idea simply due to ego issues.
On the other hand, I've seen people fight over which way the toilet paper is supposed to go on the roll. So....go figure.
Here's you in your diary
Here's you in your diary from early July:
==============
You clearly and unequivocally said that the seasonally adjusted numbers were hiding the "real" upward trend that was revealed in the unadjusted numbers.
So, how has that worked out? Here are the raw weekly, unadjusted jobless claims numbers that you said in early July were the "truth" and were going to head back up:
2009-06-20 568552
2009-06-27 559857
2009-07-04 581145
2009-07-11 671242
2009-07-18 585575
2009-07-25 511628
2009-08-01 466695
2009-08-08 482622
2009-08-15 454216
Notice that in the latest week we've had the lowest jobless claims of the entire year 2009. So the thesis of your diary from last month was wrong.
And with your diary today, your logic admits it:
In other words, all of a sudden it is the "seasonally adjusted" numbers which are the "real" numbers, and the unadjusted numbers which are obscuring the truth.
You can't have it both ways. Either you stick with the unadjusted, which went up last month and are dramatically down now, or you go with the seasonally adjusted numbers.
On that score, let me reiterate your conclusion from your diary last month:
We already know that unadjusted claims are down dramatically since, but was June the month of "settling down" after which jobless claims were going higher? Here's the seasonally adjusted data starting from the June "settling down" data point:
2009-06-06 622750
2009-06-13 616750
2009-06-20 618000
2009-06-27 616000
2009-07-04 607000
2009-07-11 585000
2009-07-18 567250
2009-07-25 560250
2009-08-01 556500
2009-08-08 565750
2009-08-15 570000
The numbers simply show that your thesis was incorrect. At no point since June has the average approached the 600,000+ level at which it had, in your terms, "settled down", and from which it was "actually on the rise."
If the 4 week moving average, seasonally adjusted, moves up over 618,000 you've got a point. Right now what I see is an average which is consistently lower than June's and is moving sideways in the 560-570,000 range.
I'm sorry, but as of now your diary's thesis has to be regarded as a dead black swan.
now wait a minute
firstly I will be moving this entire thread to middle's post...
but secondly, I think one needs to explicitly talk about initial claims vs. ongoing unemployment.
Unemployment is rising. We have some new data that doesn't look good, we'll see when the monthlies come out but the actual rate is increasing, plus people are falling off of the roles...
So, can we please differentiate between initial claims vs. the overall U3, U6 seasonally adjusted or not?
Bob, I'm through with this
either you ban New Deal Democrat, or I leave Economic Populist forever.
He was given the opportunity to admit that he had made a mistake in being fooled by the data, but he's chosen to try to spin what he's saying.
He's either lacking in intelligence or integrity, and I'm not going to stick around here if he's going to keep pulling this shit.
woah!
now come on folks, what is all of this about anyway?
I don't really understand what is going on here as of late...
why the hostility, the attacks...
you guys, it's friggin' numbers!
I don't want to ban anyone, I want everyone to return to their logical brain and start paying attention to the points.
I just did and ya know what am I missin' here?
Also, may I point out that within Academia circles, one will deal with many a critic, often public and often to incense. Don't let things get under your skin in so many words or baby with bath water.
1. Every single one of you is wrong in using the Black Swan analogy for simply trying to play pin the tale on the end of the economic recession. Two very different concepts here.
2. Am I missing something? I mean even the main stream economists are predicting unemployment will rise? Are they pulling that out of their ass? (like many things they do pull out of there)?
3. How come I'm staring at these statistics and also seeing recently initial claims weeklies and seeing a rise?
$. What are you guyings going to town over the unemployment numbers? In all seriousness, it's like a public brawl of some burly dudes all the while the house they are fighting in front of is burning down! Everybody get over this data point argument and start looking at the same we got > 10% plus unemployment in 26 states, 16% + U6 and flip out! That's incredible! Let's all talk about that!
Unemployment vs. initial jobless claims
MfM's diaries are about initial jobless claims. The unemployment rate is another beast entirely.
in your retort
you mixed initial with total unemployment predictions which middle was implying with the seasonal auto worker adjustment that was already previously done earlier in the year. (and I still don't know those raw numbers btw)
I guess I won't mention that Roubini is saying the risk
of double dip recession is growing. Man, we are sooo screwed but we are arguing over unemployment data points.
There are other macroeconomic factors - how about the fact that consumer spending makes up 70% of gdp but we have households still loaded w/debt. We have a financial oligarchy that is still running unrestrained. We have wage stagnation and growing income inequality. We are about to experience 'purgatory' or 'new normal' and there are ABSOLUTELY NO policy proposals addressing that.
Carry on.
RebelCapitalist.com - Financial Information for the Rest of Us.
RebelCapitalist.com - Financial Information for the Rest of Us.
right on! The middle class is crashing & burning here
and we have a host of posts, from all people in this "heated discussion" I might add, who are all demanding some sort of modern day public works program to get U.S. citizens/LPR income.
Yet on the MSM, all they can talk about is the consumer! Jack asses, that consumer is your neighbor who was just foreclosed on!
Per Rob Oak's earlier comment,
if you think I'm wrong, prove me wrong with a calculator.
What in either of your two posts do you believe I am misprepresenting? Show me the numbers.
Right now here's what I see: you believed that non-seasonally adjusted initial jobless claims showed that the "real" jobless claims number had bottomed in June and was moving up, and showed the "real" trend. Now you are saying that it's the seasonally adjusted number that are the "real" numbers, and bottomed in July. Which is it?
Or, put another way, what number, seasonally adjusted or unadjusted, at what time would prove you wrong or prove you right?
firstly some graphs
Below are weekly initial claims, not seasonally adjusted, seasonally adjusted and moving average, for May 1, 2009 to August 15, 2009.
So, I think I have narrowed down this argument. middle is referring to just the auto layoffs and not to all of the seasonal adjustments done in the entire BLS time series for unemployment and various labor markets due to cyclical seasonal conditions.
So, the next question is....what specifically are the seasonal adjustments, across the entire labor market and what percentage of that is for auto layoffs they normally assume take place during the summer for retooling?
The ICSA is the graph you want to look at
MfM's best substantive point is that auto layoffs distorted the usual seasonal pattern noted by the BLS. As a result, MfM claims, the claims during the 3 weeks in July when the BLS subtracted a large number of claims to arrive at their seasonal number should be disregared. Well, here's what the graph of weekly jobless claims, seasonally adjusted, w/o averaging over 4 weeks, looks like when we omit those three weeks:
Any personal honestly looking at that graph must admit that it continues to decline after the 3 week distortion for auto layoffs. Not the increase over June that MfM was predicting.
Additionally, as I told MfM a month ago, you can't double count. If you add to the July numbers, then you must subtract from the April-June numbers the same amount. Looking at the chart prepared by Tim Iacono, it appears that in the 9 years before 2009, auto companies laid off ~48,500 workers in July, as opposed to ~9000 this July. Let's make the difference 40,000 and add 13,500 a week to the three affected weeks in July. To make up for that, let's subtract 4000 x 8 weeks in April and May, and 2000 x 4 in June, approximating the higher number of layoffs shown in Iacono's chart.
When we do so, here is the table of initial weekly jobless claims, seasonally adjusted, we get from the March 28 high:
2009-03-28 674000
2009-04-04 660000
2009-04-11 609000
2009-04-18 641000
2009-04-25 631000
2009-05-02 601000
2009-05-09 639000
2009-05-16 632000
2009-05-23 621000
2009-05-30 621000
2009-06-06 603000
2009-06-13 610000
2009-06-20 628000
2009-06-27 615000
2009-07-04 582500
2009-07-11 537500
2009-07-18 572500
2009-07-25 589000
2009-08-01 554000
2009-08-08 561000
2009-08-15 576000
Again, anyone honestly looking at this table must admit that it shows a continuing declining trend all the way through June and July into August.
Sorry NDD
Firstly the actual GM layoffs, were staged, they were announced in Fed. but since that time the numbers are larger. but they stage layoffs over weeks and months. It looks like the "big one" happened in February, not April.
Secondly, MFM never said there would be an increase in June, plus your graph shows an increase in June. What MfM is referring to is that huge down spike in initial claims in July. As I understand this, that's the distortion, where the BLS model assumes 48k temporary layoffs.
then, the SA assumes they will return in Sept. but in fact only a few returned.
Finally, the August data is not complete. We see an uptick in SA initial claims for August already.
I don't see MfM 'counting things' twice, I do see he could tighten up his exact dates some more plus get the specifics on precisely how SA is enacted for 2009, what exactly are those numbers?
But I think there is something else going on. I've seen Bonddad's posts as well and may I suggest blasting him for ignoring major data points, details in some of those posts. He truly is, as well as ignoring the now needed 2% plus positive GDP just to break even. I could go through the list, but I think in terms of overall analysis, one could assuredly chew on his leg for awhile in terms of ignoring of data points, distortions and inaccuracies.
As far as "black swan" goes, myself I believe there is a "tipping point" on squeezing the U.S. middle class that can cause a sudden Economic Armageddon potentially. I'm more apt to believe the long slow decline into 3rd world status but I won't rule it all out.
But it does appear MfM's original argument, that the July 15, 2009 SA data point is an anomaly, due to the SA that had in reality happened much earlier and also was not temporary is correct.
Is it an outliner big enough to cause a catastrophic event? I don't think so. Is the unemployment rate, the state of work in America large enough to cause a cascading depressive effect on the entire economy? Possibly, esp. due to this continual focus on the U.S. citizen as a consumer and somehow when they start "consuming" all will be well. Relying on that happening.....we might be at the "consumption" tipping point.
Then, what effect will Cash for Clunkers have? It's clearly stimulative for the auto industry, I"m hearing reports dealers have literally cleared their lots of inventory. But it is also temporary. Will it lead to an overall increase in sales over time? Who knows at this point, but will it show up as an increase in temporary hires at least? At the dealers it sure appears to be, they all had to hire temporary staff to deal with the overflow.
So, I think the entire lesson is this. Do not take one unemployment data point and try to claim it's a trend. I think there is a reason that the NBER waits so long to declare cycle bottoms and this has to be one.
I mean what a EI! Firstly only 48% of people even qualify...so there is a very serious distortion right there...in Sept 1. about 240k are rolling off of the count...that is significant...the qualifications for UI on initial claims also have a serious of qualifying conditions, i.e. if someone is hired, then fired 2 weeks later, they may not qualify and so on, it also has total income qualifiers.
Not exactly the ultimate 1:1 real time correlation and in my view, the entire BLS needs to be revamped, increased funding and a much better statistical series, data points, methods given. Esp. considering over half the workforce is never even up to be counted currently.
Sorry, Bob
1.
You're right he never said there would be an incrase in June: MfM's July diary was crystal clear that June was the bottom and that the increase of unadjusted first time jobless claims in July was the real trend.
2. There is no reason for callbacks to be reflected in the initial jobless claims rate -- after all, callbacks are not jobless claims. I'm sure they would affect nonfarm payrolls, the unemployment rate, and continuing claims -- but not initial claims.
There is no reason to go round and round further, but hopefully by now MfM understands that I still believe his thesis is wrong, and why.
he is not wrong and you are not wrong
which is my main point....a data point does not a trend make. In this case a data point is over a month's worth of data.
August is not even out and that is really the next data point...
What I hope this entire exercise leads to is digging deeper into precisely what these EIs really measure and to me, there is nothing more important while loaded with problems than the unemployment statistics.
What this entire thing leads to is to write up inadequacies with the current measurement system and how we need much more accurate, much more real time statistics on the state of labor in this country. We need immigration status (they count guest workers in the statistics), we need real time monthly occupational data, we need better stats on ind. contractors, 1099-misc, small businesses and how they are doing, what percentage of the working pop is getting denied benefits and why, what is the current state of being denied a position in one's career field, how many drop out per occupations, at what age. How many are being forced into "early retirement", how many cannot find work and have zero public social safety net whatsoever....this list goes on and on.
Ya know you cannot get, at all, how many jobs are offshore outsourced and now it's even more hidden because instead of firing people in the U.S. to offshore outsource the jobs ...corporations are simply creating those jobs in other countries....
Yet when it comes to any real accurate data on this...corporations hide it worse than their offshore tax haven accounts.
We do not even know what specific factors are completely involved in the July SA adjustments vs. the August SA adjustments and this is for initial weekly claims...
BLS refuses to release it, instead gives you this and this.
So, frankly I cannot even verify from the SA if they added the auto layoffs wrong or not from the BLS.
Where did this come from?
NDD wasn't doing anything but quoting you and forcing you to explain yourself further.
It's well known that I don't agree with NDD's take on the economy, but since no one here has a crystal ball we are all forced to listen to and consider all viewpoints.
Black Swan
By the way, what is this continual use of the Black Swan? The book is about derivatives really, structured finance, use of Gaussian distributions in mathematical models that are not valid...as well as those events in the "tails" of Gaussian distribution too often dismissed as improbable.
I would say the money market situation that Bernanke guaranteed was indeed a black swan and also what the book is talking about...
on the other hand, why is this term being used in reference to trying to play the game pin the tail on the recession end point?
I just commented on "pin the tale on the recession end point"
Now, look, I believe bonddad's analysis is dead wrong in many ways and that's why EP exists, so we can argue on these things and look at different aspects.
I wrote up many posts on the various EIs and said, ya know what, this is the end of the cliff but sure doesn't look like any recovery in that you get a "V" with GDP correlated to decreased unemployment and so on that is trying to be implied.
But what I don't get is jumping on this whole black swan thing...anybody really read the book?
Or do they all just think Taleb is an asshole (I get a strong impression that's true), hence trying to dismiss his very good insights into structured finance, derivatives and mathematical modeling?
side comment for NDD& MfM
time out guys, OK? I enjoy both arguments amd both perspectives, and I don't want to have keep chasing you both around the net just to be able to get your perspectives.
I've been watching this mess and reading a number of sites, Including Bonddad, and I think he has an emotional investment in the success of this administration's approach. I don't get the impression he sees what the situation on the ground is--the map is not the terrain. why would we want to return to the status qou ante? until we clear the ledgers of all the red ink, we are fu**ed long term. Short term bounce,sure, but it's like sanding an icy road- we may not fall flat on our ass, but we're sure as hell not going sprint back to prosperity
Don
Agreed
I agree with Juan...cool down guys. I love this site and have been a near daily reader for a couple of months now. Both of you (NDD and MFM) have often provided some great information that has enlightened me as I'm sure it has others. One of the things I love here is the general lack of name-calling and personal attacks that so often make reading a blog's comments section like returning to a grammar school. So please both take a step back for a moment and realize that in the big picture, you're both on the same side. Thanks!
Welcome to EP Scooter and JuanDonJuan!
Boy, nothing like a good spat to bring out the lurkers to say take a chill pill.
Glad you're here and hopefully others will stick around and comment.
Thanks!
Thanks for the welcome...and for the work on this site.
seasonal adjustment
For anyone who wants to know, finding out and arguing all of the seasonal adjustments being used...
start with ARIMA and there is even free software from here.
But it's our friend Gaussian distributions and so on, although such a large seasonal layoff such as the auto plants assumed to be shutting down for retooling....
I don't think one necessarily has to run this but at least understand seasonality
and realize this is done over time, a long time by running auto correlations with the past...
so a large anomolie like the entire auto industry shutting down months early....
would throw the numbers for seasonal...while not being the total seasonal adjustments.
Anywho if one really wants to Q.E.D. in this argument, you can literally dig deep into the seasonal methods for employment in the U.S.
Bonddad writes GBCW on DK
Bonddad's CBCW on DK.
Ok, so obviously we have massive spill over, with friends and acquaintances kind of taking sides and pot shots at each other.
This is precisely what EP is not supposed to be.
While we can argue with Bonddad, other posters, etc. over EIs, policy, what is means, what it doesn't mean, even argue over SA adjustments when we don't really have the SA curve (isolated, the raw adjustment numbers for the year) to get to the real meat...
One thing on EP we should not do is end up in a brawling argumentative, take it personally attack.
This shit is hard folks. It's very hard and why even a PhD in it doesn't mean one has a clue. Never mind add the layers upon layers of "think tanks" and special interests agendas to make various huge buckos and on and on....
So, with that, let's all remember to be respectful and stick to arguing the economic data points (unless we get really whacked out economic fiction and someone freaking out because we're calling it as such) ...
nobody is making any money off of this. Not a one of us. I wish it was not true, we sure do have enough readers! (I'm trying to get this site some damn money!) but more to the point, we're all doing this because it's interesting, we all see that there isn't enough ind. analysis going on out there, the public is oblivious to the details....
let's remember our real motivations and also remember, any of us, all of us, can make mistakes....
If bonddad decides to stop by and post on EP, please keep discussion to data points and civil. I also think he's wrong, but we have something other people do not have....
we have backgrounds in economics, we have mathematics degrees, we have a good understanding of economic facts, policy data points...
let's all use those and avoid ending up in one of those
DK pie fights. They are so friggin' stupid and assuredly one of the reasons EP is started (as well to get the focus on real policy that affects real people instead of analyzing if Obama's photo had been "darkened" and if so, does that imply "racism" and so on).
Let's make sure EP is a pie free zone.
My $0.02
I think its a bad move on Bonddad's part, as it will reduce his influence. But that's no skin off my nose.
I don't think that EP has much of a problem with flames. There's occasional testiness, but that is unavoidable.
As far as I'm concerned, it's a non-issue here.
Here here, RO!
I've been on the radio with Bonddad for almost a year now, and I have to say the man is a true gentleman. He has been civil with those who disagree with him, and when he's wrong he fesses up. That is a lot more than many other bloggers on some other sites.
Amen also to a call for civility. A lot of sites, if you aren't 100% in agreement with some members of a site, you're branded a traitor or worse. For example, I am a libertarian capitalist who believes in a flat tax, but I go on Daily Kos because I believe in civil liberties and opposed to foreign interventions.
The same with this place, I know many here would disagree with me on many things, but I come here because I too share a belief in manufacturing. At the end of the day, we all have something to contribute, so long as it's constructive and by the host's rules. This is, in the end, Robert's website, who has graciously allowed us to post something. Robert's reputation is on the line when we add a diary. Hence his calls against what he deems "Economic fiction," because you just can't post anything. His site, his property. Its like visiting someone at their home, one should always be polite and courteous.
--------------------------------------------
www.venomopolis.com
it's not "my" site
In all seriousness, to the point I've been trying to figure out "who gets it" if something happened to me.
I end up being more blog cop than I really want to be and why I tried to add so many user content controls on the site...
the point is to give voice to a host of people who are really digging deep into financial/economic topics...
I don't like those dictatorships of other sites when it's the people who write on them who actually "make" a site be super cool and take off.
EconPic has picked up on this topic
With a very good post noting also the SA vs. non seasonal disconnect.
He is huge with original graphs, nicely done.
mass layoff non-seasonal disconnect